

In preparation for trading VIX ETPs in 2016, I wanted to share the expiration date for all monthly VIX futures next year as well as the number of days in each roll period. Table below (source calendar).
Expiration Date Roll Period Length
- Ending January 20: 23 days
- Ending February 17: 19 days
- Ending March 16: 20 days
- Ending April 20: 24 days
- Ending May 18: 20 days
- Ending June 15: 19 days
- Ending July 20: 24 days
- Ending August 17: 20 days
- Ending September 21: 19 days
- Ending October 19: 20 days
- Ending November 16: 20 days
- Ending December 21: 24 days
2016 VIX Futures Expiration Days And Roll Period Lengths
-JW
. . . . . . . . . . . . . .
 Stay up to date by having posts sent directly to your
RSS feed or
Email.
Stay up to date by having posts sent directly to your
RSS feed or
Email.
The Most Important Chart For Trading Volatility ETPs
On April 5, 2014 I wrote an article titled Shorting Volatility: Time To Reduce Profit Expectations for 2014 which outlined why I thought it would be difficult for XIV (the fund which tracks the inverse daily return of volatility futures) to finish positive for 2014. When the article was published XIV had returned an impressive +547% over the past 28 months, as shown in the chart below.

Understandably, many people disagreed with my view, yet XIV finished the 2014 year -9%.
Later in 2014 (September) I wrote The End of an Era for the Market, in which I discussed how a choppy market that is no longer a reliable environment for shorting volatility had become the norm as the Fed concluded their QE program. XIV lost 37% of its value over the next four months and is currently down 30% since that post.
If it wasn't already clear, XIV is not a buy and hold security. It has returned -20% over the past year and -7% over the past two years. The environment is not the same as what it was in 2012 and 2013.
How did I make these calls?
Because returns in XIV are heavily dependent on the Weekly Roll Yield (WRY).
A major factor for the lower returns in the past two years comes from a smaller weekly roll yield that is used to propel XIV. The inverse of the XIV WRY is the VXX WRY (which comes from the difference between first and second month VIX futures). We track this important metric on our site, and as you can see in the graph below, the roll yield has moved from -2% to -1% over the past several years and has recently started to move toward 0%.
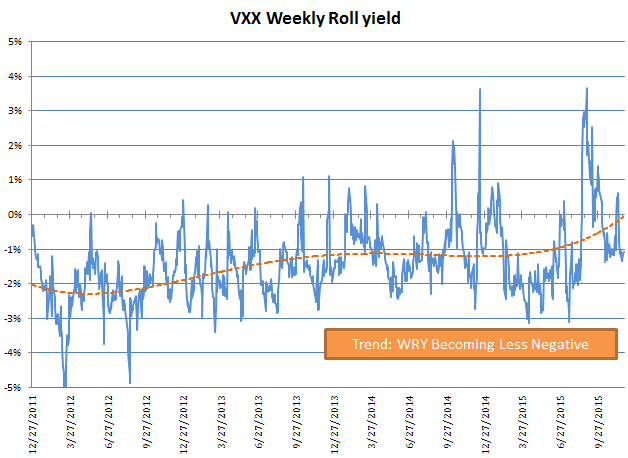
This is most important graph because the WRY serves as a headwind or tailwind to VIX ETPs. As the WRY approaches zero, trends become less stable and our advantage in trading XIV or VXX diminishes. Conversely, as the WRY moves away from zero trends become stronger.
Right now there is less of a headwind for VXX and less of a tailwind for XIV/SVXY. At this point in our old bull market we are also at high risk for the VXX WRY turning positive, which would give VXX a tailwind and XIV a headwind.
Revisiting our graph which compares the annual returns of XIV to the average Weekly Roll Yield (below), we can see why the WRY is so important.

Looking at the trendline we can see that with a fairly constant 1% WRY, we can generally expect XIV to return ~+25% per year. As the average WRY moves towards 2% we can expect XIV to return ~+120% per year. At 0%, XIV is likely to return ~-60%. The recent shrinking of the WRY from 2% to 1% has an enormous impact on returns and that's why it is so important. A continued move of the WRY toward 0% or higher would be alarming to investors who plan to buy-and-hold XIV.
Because the WRY is such an important factor in the performance of VIX ETPs, our approach is to trade XIV and VXX using the WRY as a primary input for our VXX Bias and ZIV Bias indicators (our strategies are outlined here). While XIV is negative on the year, our VXX Bias indicator has put forth a performance of +33% YTD.
No credible trader will ever say that trading is easy, and that is doubly true when it comes to volatility. It requires a deep understanding of market forces, a solid process-oriented plan, and discipline in execution. In the current environment it will be more important than ever to stay on top of changing conditions.
We have been in the business of helping traders stay on top of the volatility market for three years now. We look forward to a fourth year of providing a variety of free data services throughout our website and are always happy to answer questions submitted through our Contact page. We also offer subscriber services to people looking for additional data, metrics, automated alerts and daily summaries, and access to a community of volatility traders. If you're interested, don't hesitate to drop us a line.
------------
Hypothetical and Simulated Performance Disclaimer
The results are based on simulated or hypothetical performance results that have certain inherent limitations. Unlike the results shown in an actual performance record, these results do not represent actual trading. Also, because these trades have not actually been executed, these results may have under- or over-compensated for the impact, if any, of certain market factors, such as lack of liquidity. Simulated or hypothetical trading programs in general are also subject to the fact that they are designed with the benefit of hindsight. No representation is being made that any account will or is likely to achieve profits or losses similar to these being shown. Additional performance differences in backtests arise from the methodology of using the 4:00pm ET closing values for XIV, VXX, and ZIV as approximated trade prices for indicators that require VIX and VIX futures to settle at 4:15pm ET.
-JW
. . . . . . . . . . . . . .
Stay up to date by having posts sent directly to your
RSS feed or
Email.
The Classic Long Term Investment Model
In a change of pace, today's post is a gift for the more passive retirement investor. I will share a common investing template used by Financial Advisors as well as the new Robo-advisors. If you are a "do-it-yourselfer" this info can save you tens of thousands of dollars in fees that would otherwise go to an advisor.
The basic portfolio strategy used by many FAs is based on Modern Portfolio Theory (MPT). The main idea is to diversify investments across various categories of global assets in order to reduce overall portfolio risk. This is accomplished by allocating dollars to a mix of equity and bond funds. People who have a longer investment horizon typically utilize a more aggressive investment approach which places a heavier weighting on equities. This weighting shifts gradually towards a larger weighting on bonds as you get close to your retirement date.
The following chart provides example fund allocations.

The strategy dictates that once you decide on your overall portfolio balance you allocate funds based on the percentages in that column. Every six months you need to re-balance your portfolio by buying and selling securities in amounts so that they again match the target allocation percentages. Any additional contributions made to the fund are done using the weightings specified.
Modern Portfolio Theory is the most widely accepted framework for managing diversified investment portfolios, however it has its limitations. One such limitation is the fact that it ignores the possibility of significant market selloffs. Overall returns can be improved by augmenting the basic MPT framework with a sound strategy for including volatility funds in the model, however I'll need to cover that in a future post.
The above chart can be very helpful, but if you are not willing or able to rebalance the portfolio then you will likely not be optimizing your returns. In addition, if you are someone who gets nervous and wants to sell anytime the market becomes dramatic then you may have difficulties sticking to an investment plan. One part of a FA's job is to keep you invested and on a plan to help prevent you from selling when it is not beneficial to do so (more on Financial Advisors below).
A Note On Financial Advisors
A good Financial Advisor will provide more that just the investment strategy offered above. They will also help open a dialogue about what financial needs you and your family have and help you develop and execute plans to achieve those goals. They can help you with things like saving for retirement, saving for a house, saving for education, budgeting, tax strategies, and develop custom investment solutions should you have specific needs.
A Note On Robo-Advisors
Robo-Advisors are good for people who want to just set their portfolio agressiveness and have the rest automated. You're still mostly on your own but the fees are much lower so it can be a good alternative to a traditional Financial Advisor for people with simple needs. Robo-Advisors like to highlight their tax optimization feature through something called Tax-Loss Harvesting. For anyone using a retirement account, Tax-Loss Harvesting is completely irrelevant because most retirement accounts are tax deferred.
Disclaimer
The above information is for educational purposes only and is not financial advice.
-JW
. . . . . . . . . . . . . .
Stay up to date by having posts sent directly to your
RSS feed or
Email.
A Focus On Process Is Critical To A Trader's Long-Term Success
We are now eight months into 2015 and it's time to once again check in on YTD performance. The last three months have been difficult for the market and we saw a great example of why successful traders are process-oriented rather than results-oriented. So before we get to the scoreboard, let's look at the difference between the two.


Traders need data-driven, reliable, observable, and easy-to-follow trading rules in order to set themselves up for success. Talk to any successful professional and you'll get hear the common theme of process-orientation as one of the keys to success. I'll talk more about how this came into play later in this post.
Now, on to the scoreboard.
The S&P 500 and XIV ("short" volatility ETP) have suffered since our May update, with the S&P 500 -4.2% on the year and XIV now -18% through August. VXX ("long" volatility ETP) is in the same ballpark at -15% while ZIV ("short" medium-term volatility ETP) is -8%.
Now, on to the scoreboard.
The S&P 500 and XIV ("short" volatility ETP) have suffered since our May update, with the S&P 500 -4.2% on the year and XIV now -18% through August. VXX ("long" volatility ETP) is in the same ballpark at -15% while ZIV ("short" medium-term volatility ETP) is -8%.
Fortunately we're not part of the buy-and-hold crowd and instead use our custom indicators to trade volatility ETPs on both the long and short sides (learn more about our strategies here).
Our indicators now sit at (year-to-date, through August):
- VRP+VXX Bias: +40%
- VXX Bias: +69%
- VRP: -7%
- ZIV Bias: -2%
Overall, our indicators actually lost ground since their peaks in June after facing some difficult market conditions from late-June to mid-August. The equity curve can be seen below.

While it can be frustrating to watch some of our gains disappear, this is where the process-orientation kicks in. We know that drawdowns happen in volatility trading, and when they do we refer to our flow chart from above.
Did we lose because we adhered to the trading rules?
Or did we lose because we broke the rules?
Even when you adhere to the rules, the "No big deal" attitude is tough to achieve when dealing with losers. This is especially true when they are back-to-back-to-back-to-back and result in multiple monthly losses. But while those short-term losses can feel painful, it's the long term that we care about. The pros continue to focus on the process of trading using proven indicators rather than short-term outcomes.
By looking specifically at monthly returns we can get a feel for how bad the past few months have been. First, the VRP+VXX Bias indicator had two consecutive months in June and July that were almost as bad as any on record, before recovering a bit in August.

The next chart shows monthly performance for the VXX Bias indicator. Once again, June and July saw two of the worst consecutive months on record, with performance very similar to that of June/July 2011.

August, however, turned in the third best month ever, rewarding those able to keep trades mechanical and process-driven.
For those interested in additional details of the indicators, the daily history of indicator values that have been emailed to subscribers in 2015 can be found in the data sheet links below:
If you're struggling to meet your investment objectives in this year's difficult market, perhaps we can help. For less than $3 per day we provide subscribers access to all of our VIX data & metrics, our indicators, automated change alerts, and the members' forum.
______
Hypothetical and Simulated Performance Disclaimer
The results are based on simulated or hypothetical performance results that have certain inherent limitations. Unlike the results shown in an actual performance record, these results do not represent actual trading. Also, because these trades have not actually been executed, these results may have under- or over-compensated for the impact, if any, of certain market factors, such as lack of liquidity. Simulated or hypothetical trading programs in general are also subject to the fact that they are designed with the benefit of hindsight. No representation is being made that any account will or is likely to achieve profits or losses similar to these being shown. Additional performance differences in backtests arise from the methodology of using the 4:00pm ET closing values for XIV, VXX, and ZIV as approximated trade prices for indicators that require VIX and VIX futures to settle at 4:15pm ET.
-JW
. . . . . . . . . . . . . .
Stay up to date by having posts sent directly to your
RSS feed or
Email.
Our Indicator Performance: +71% YTD Through May
Inverse volatility ETFs continued their uptrend in May with XIV adding 13.4% during the month, bringing its year-to-date gains up to +45%. Here's a look at XIV's YTD chart:

A 45% gain in the first five months of the year is pretty good, but our indicators are all outperforming the buy-and-hold approach. Here is the performance of our indicators in 2015, through May 29th:
- VXX Bias: +69%
- VRP: +60%
- VRP+VXX Bias: +71%
The equity curve for each strategy with comparison to XIV is shown in the following graph (the S&P 500 is +2.4% YTD and is not shown):

Trade statistics for each strategy are summarized as follows:
If you're not quite meeting your investment objectives this year perhaps we can help. For less than $3 per day we provide subscribers access to all of our VIX data & metrics, our indicators, automated change alerts, and the members' forum.
For those interested in additional detail, the daily history of indicator values that have been emailed to subscribers in 2015 can be found in the data sheet links below:
- VXX Bias: 2015
- VRP: 2015
- VRP+VXX Bias: 2015
______
Hypothetical and Simulated Performance Disclaimer
The results are based on simulated or hypothetical performance results that have certain inherent limitations. Unlike the results shown in an actual performance record, these results do not represent actual trading. Also, because these trades have not actually been executed, these results may have under- or over-compensated for the impact, if any, of certain market factors, such as lack of liquidity. Simulated or hypothetical trading programs in general are also subject to the fact that they are designed with the benefit of hindsight. No representation is being made that any account will or is likely to achieve profits or losses similar to these being shown. Additional performance differences in backtests arise from the methodology of using the 4:00pm ET closing values for XIV, VXX, and ZIV as approximated trade prices for indicators that require VIX and VIX futures to settle at 4:15pm ET.
-JW
. . . . . . . . . . . . . .
Stay up to date by having posts sent directly to your
RSS feed or
Email.
A Note on Corrective Distributions for VXUP & VXDN
I've outlined the basic operation of AccuShare's new VXUP and VXDN funds in this post (as they are designed, but not how they'll actually be able to operate). However I did not go into sufficient detail on the topic of Corrective Distributions.
Before I get into that though, I'll mention that AccuShares has already told us that VXUP and VXDN are intended only for sophisticated professional and institutional investors. If you're not in that category you will likely find the following information less useful since you won't be trading these products.
Corrective Distributions are used to help keep the funds trading near their NAV (Net Asset Value). In my previous post outlining the Fatal Flaws of VXUP & VXDN, I explained why it will be common for these funds to trade at a premium or discount to NAV. In fact, as of Friday, VXUP is already trading at a 19% premium to NAV while VXDN is trading at a 17% discount to NAV. Recall that if the closing trading prices deviate from their NAV by 10% over three consecutive business days, the Fund will make a Corrective Distribution on the next scheduled Regular Distribution Date or Special Distribution Date (note: this rule goes into effect only after 90 days since the fund's inception has passed).
Here's what happens during a Corrective Distribution:
A Corrective Distribution trigger should help close the gap to NAV in advance of the next Distribution Day so that no such "easy money" can be made/lost. Even the threat of a Corrective Distribution trigger (trading at >10% NAV on the third day) could bring about swift moves towards NAV for each of the funds as traders move to close out positions while the premium to NAV is still double digit percentages, or rush to get into positions that are trading at a large discount to NAV. This pressure may even be enough to prevent the completion of a Corrective Distribution trigger on the second or third day of a threat, resulting in wild daily price action.
After a Corrective Distribution Day I expect the funds to immediately diverge from NAV once again. If the VIX futures term structure is sufficiently steep, the funds will face a threat of a Corrective Distribution trigger again for the following month. This will make it important to constantly keep an eye on the market prices versus NAV and factor these potential events into your trading strategy.
Before I get into that though, I'll mention that AccuShares has already told us that VXUP and VXDN are intended only for sophisticated professional and institutional investors. If you're not in that category you will likely find the following information less useful since you won't be trading these products.
Corrective Distributions are used to help keep the funds trading near their NAV (Net Asset Value). In my previous post outlining the Fatal Flaws of VXUP & VXDN, I explained why it will be common for these funds to trade at a premium or discount to NAV. In fact, as of Friday, VXUP is already trading at a 19% premium to NAV while VXDN is trading at a 17% discount to NAV. Recall that if the closing trading prices deviate from their NAV by 10% over three consecutive business days, the Fund will make a Corrective Distribution on the next scheduled Regular Distribution Date or Special Distribution Date (note: this rule goes into effect only after 90 days since the fund's inception has passed).
Here's what happens during a Corrective Distribution:
- First, the Regular or Special Distribution takes place (as outlined in my first post on the topic).
- Next, each remaining share will be resolved into a risk neutral position comprised of an equal number of Up Shares and Down Shares, based on the share NAV.
The key item here is that the value is based on NAV, not the market trading price. Therefore, holders of a security that trades at a premium to NAV will take a loss equal to the amount of the premium on Distribution Day. Likewise, holders of a security that trades at a discount to NAV will see a gain equal to the amount of the premium.
A Corrective Distribution trigger should help close the gap to NAV in advance of the next Distribution Day so that no such "easy money" can be made/lost. Even the threat of a Corrective Distribution trigger (trading at >10% NAV on the third day) could bring about swift moves towards NAV for each of the funds as traders move to close out positions while the premium to NAV is still double digit percentages, or rush to get into positions that are trading at a large discount to NAV. This pressure may even be enough to prevent the completion of a Corrective Distribution trigger on the second or third day of a threat, resulting in wild daily price action.
After a Corrective Distribution Day I expect the funds to immediately diverge from NAV once again. If the VIX futures term structure is sufficiently steep, the funds will face a threat of a Corrective Distribution trigger again for the following month. This will make it important to constantly keep an eye on the market prices versus NAV and factor these potential events into your trading strategy.
-JW
. . . . . . . . . . . . . .
Stay up to date by having posts sent directly to your
RSS feed or
Email.
The Fatal Flaws of VXUP and VXDN
Today's post is a follow up to last week's post, "Details on New VIX ETFs: How VXUP and VXDN Work." In hindsight, the title should have included the words "in theory" because the reality of how these funds work is drastically different. The funds are subject to strong arbitrage pressures from VIX futures and will constantly be trading at a premium or discount to the funds' theoretical price, known as Net Asset Value, or NAV (also sometimes referred to as the fund's "Intrinsic Value").
In real trading, the major problem with the concept of these new funds is the presence of a VIX futures term structure that can range +/-20% at times. When AccuShares announced the launch of an ETF that tracks spot VIX, everyone immediately looked forward to getting in on the arbitrage trade to be long VIX and short front month VIX futures during contango. After all, spot VIX and futures converge each month and this trade is essentially free money. The reason for the price difference between spot VIX and futures stems from the principle that VIX is mean reverting. This generally keeps the price of VIX futures higher than spot VIX when VIX is lower than ~20 (the long term average) and VIX futures lower than VIX when VIX is above ~20.
We saw this arbitrage gap close quickly in the first day of trading of VXUP and VXDN. VIX was +0.94% on May 19, while $VXUP was +10.56% and $VXDN was -10.56%. That's not at all tracking towards spot VIX. That is adjusting toward June VIX futures. Such behaviour to price in known information can be expected in a free market when there are obvious pricing discrepancies in what are essentially identical products.
June VIX futures settle on June 17, which is only two days away from the VXUP/VXDN Distribution Day on June 15. Given that the objective of VXUP & VXDN is to track the monthly change in spot VIX (plus an adjustment for the "Daily Amount"), the funds immediately move toward the expected value of VIX on June 15 -- the fair value of which is already agreed upon by market participants by the price of June VIX futures.
There is nothing unique to the month of June that causes these funds to suddenly track at a wide premium and discount to NAV. In fact, the funds will stray from NAV on almost every day in order to account for the value of VIX futures. Generally, the stronger the degree of contango or backwardation the larger the premium or discount to NAV.
It seems that AccuShares (the funds' sponsor) understands these forces, hence the reason for an arbitrary 0.15% "Daily Amount" which is subtracted from VXUP and added to VXDN when VIX is below 30 (another arbitrary threshold). This 4.5% roll yield that was built into the fund operation attempts to mitigate the effects of the contango roll yield. When the VIX futures curve is greater than a 4.5% contango, the only logical purchase is VXUP, leaving no one to buy VXDN.
Using yesterday as an example, an investor looking for protection can either buy June VIX futures at 14.85, or purchase VXUP at a price reflecting a spot VIX of 12.73. If VIX rises to 14.85 by June 17th, the buyer of VIX futures broke even while the purchaser of VXUP gained 11.2% (15.7% minus the Daily Amount of 4.5%). Arbitrageurs are well aware of this and will keep the price of VXUP and VXDN away from their NAV in an amount that reflects the degree of contango or backwardation in VIX futures. VXUP and VXDN will trade at values which close the arbitrage gap, not at NAV.
Today is May 20 and is the second day that VXUP and VXDN have traded. As of yesterday VXUP traded at a 9.69% premium to NAV (which can be tracked here). Today that premium is over 10%. Given that a "Corrective Distribution" is triggered whenever the funds are at a premium/discount of over 10% for three consecutive days it is possible that we'll see triggers often. However, a Corrective Distribution trigger only helps to bring the NAV premium closer to zero as Distribution Day approaches. This does not keep the funds trading near NAV after Distribution Day since the arbitrage gap to VIX futures does not go away.
I had previously thought that the premium/discount to NAV might diminish as the next Distribution Date approached, but it is clear now that if that were the case there would be an immediate and large gap on the following morning, just as we saw on the first day of trading in VXUP and VXDN yesterday. Instead, I expect the premium or discount to be persistently present, depending on the degree of contango or backwardation in VIX futures.
I don't expect the daily movement of these products to track as advertised. I also expect Corrective Distributions to be common as the funds stray 10% away from NAV. This will make the predictability of these funds incredibly difficult for anyone who has not built an arbitrage model.
When it comes down to it, one phrase at the top of the fund's Factsheet sums it up best: "shares of the Fund are intended for sophisticated, professional and institutional investors."
-JW
. . . . . . . . . . . . . .
Stay up to date by having posts sent directly to your
RSS feed or
Email.
Details on New VIX ETFs: How VXUP and VXDN Work
Edit 5/21/2015: A follow up article, "The Fatal Flaws of VXUP and VXDN" has been posted.
--
On Tuesday next week we will see a new pair of VIX ETFs hit the market: VXUP and VXDN from AccuShares Management. Unlike existing VIX ETPs which move based on VIX futures, these new ETFs will move based on the price of spot VIX.
However, the operation of these funds is not as straight forward as one might expect. I've gone through the 150 page prospectus and have briefly outlined what you can expect from these new products (the full prospectus is available here for those interested in additional details).
Summary
- The Up Class Shares (VXUP) and Down Class Shares (VXDN) are designed to track changes in the price volatility of the S&P 500® Index on a monthly basis.
- The Underlying Index of the Fund is the CBOE Volatility Index (VIX)
- Investors who expect the VIX Index to increase should consider purchasing Up Class Shares (VXUP)
- Investors who expect the VIX Index to decrease should consider purchasing the Down Clas: s Shares (VXDN).
Basic Fund Operation
- The operation of the funds centers on "Distribution Periods" which are marked by "Distribution Dates" (the 15th of each month).
- The primary change in value of the funds is based on the "Share Index Factor", which is reset on each Distribution Date. The Share Index Factor defines how much VXUP and VXDN move for every VIX movement.
- --> Example: If VXUP is $25 (after distribution) on the Distribution Date, and VIX is at 20, each 1 point (5%) move in VIX is worth $1.25 (5%) to VXUP for the next month.
- Additionally, when the VIX is 30 or less, a "Daily Amount" of 0.15% ($0.0375 in this example) will be deducted from VXUP per day and will be added to VXDN.
Distributions
A primary concept of the funds are periodic Distributions. These will be predominantly done in cash for the first six months, but will be in the form of issuing paired shares of VXUP and VXDN thereafter (depending on the fund's liquidity). Here are the Distribution types:
- Regular Distributions: Occur on the 15th of each month (the "Distribution Date").
- VXUP will be entitled to a distribution when the VIX has increased between Regular Distributions, or by 75% (“Special Distributions”).
- VXDN will be entitled to a distribution when the VIX has decreased between Regular Distributions, or by 75% (“Special Distributions”).
- --> Exception: Both share classes subject to a maximum of 90% in either direction for a single Measuring period.
- Special Distributions: Occurs if change in VIX is +/-75% since last Distribution Date. The Shared Index Factor is also reset.
- Corrective Distributions: Following the expiration of 90 calendar days following the inception of the Fund’s operations, if the closing trading prices of the shares of the Fund deviate from their Class Value per Share by ten percent over three consecutive business days, the Fund will make a Corrective Distribution in addition to a Regular Distribution or Special Distribution on the next scheduled Regular Distribution Date or Special Distribution Date if previously triggered.
- Other distributions may result from reverse share splits.
Any distributions of cash, or cash and shares, will reduce your exposure and opportunity for gains arising from changes in the Fund’s Underlying Index in subsequent periods. You will need to rebalance/buy additional shares to maintain desired exposure. This concept will be made clear in the example below.
Price Movement Examples:
VXUP will often face a headwind caused by the "Daily Amount" of 0.15%. The table below summarizes the value of VXUP and VXDN for various VIX scenarios after a Measuring Period. Note that when the VIX is +4.5%, the gains in VXUP are offset by the losses from the Daily Amount (since 0.15*30 = 4.5).

In the next table, the VIX is assumed to have moved up 10% from 20 to 22 over 30 days. At the Distribution Date, the result is a 5.5% increase for VXUP and a 5.5% decrease for VXDN based on the combination of the VIX movement and the $0.0375 Daily Amount.


Note that the Fund will distribute a cash amount of $2,750.00 per 1,000 shares of VXUP. The new per share value for each fund is then set at $23.6250.
If instead there is a 10% decrease in VIX from 20 to 18 over 30 days we will have the following:

Here, VXUP will return -14.5% and VXDN will return a total of +14.5% based on both change in the VIX and the effects of the Daily Amount.
It is critical to note that after each favorable movement in a security held, your exposure is reduced due to distributions. In the case of issuing paired shares in lieu of cash, your exposure is still reduced and you would need to sell/buy shares as necessary to maintain a desired exposure.
It is worth highlighting that the Daily Amount only exists when VIX is below 30. When above 30 it is zero so the VXUP headwind goes away.
Supply & Demand and the Arbitrage Mechanism for creation/redemption of share units
The facts outlined above cover the basics of these new funds. There are many other additional details and nuances covered in the prospectus which I encourage you to read through if you are considering trading these products.
It is worth highlighting that the Daily Amount only exists when VIX is below 30. When above 30 it is zero so the VXUP headwind goes away.
Supply & Demand and the Arbitrage Mechanism for creation/redemption of share units
- As the Fund’s shares trade intraday, their market prices will fluctuate due to simple supply and demand.
- An arbitrage mechanism helps to minimize the difference between the trading price of a share of the Fund and its Class Value per Share. Over time, these buying and selling pressures should balance out, and a share’s market trading price is expected to remain at a level close to its Class Value per Share. The arbitrage mechanism provided by the creation and redemption process is designed, and required, in order to maintain the relationship between the market trading price of shares and their Class Values per Share between Distribution Dates.
The facts outlined above cover the basics of these new funds. There are many other additional details and nuances covered in the prospectus which I encourage you to read through if you are considering trading these products.
Bonus: Below I've included some additional risk factors contained within the prospectus that I found to be of interest.
- By purchasing VXUP, investors should have an expectation that the Underlying Index will increase during the period between Distribution Dates. If the VIX decreases during the time between Distribution Dates, investors in VXUP will experience a significant loss and could lose their entire investment.
- The Fund’s Eligible Assets are not managed to provide a maximum long-term return and even a share class experiencing a favorable Underlying Index change can experience losses if the Fund’s aggregate Class Values decline significantly. If the Fund’s aggregate Class Values decline to zero, the Fund’s Up Shares and Down Shares will lose all value, causing a total loss to all Fund investors.
- The Sponsor Has No Experience Managing Investment Vehicles. The Sponsor is recently formed, and has not previously managed any investment vehicles. There can be no assurance that the past experience of the Sponsor’s management team will be sufficient to successfully operate the Fund.
-JW
. . . . . . . . . . . . . .
Stay up to date by having posts sent directly to your
RSS feed or
Email.
Our Indicator Performance +56% YTD Through April
April was a great month for inverse volatility ETFs and XIV in particular as it gained nearly 16% over the month to settle at +29% YTD. The trend was generally strong and without drama this month although it did give back some gains in the last week. XIV's one-month chart:

Our daily indicators rode this wave of gains throughout the month on only one trade, with the VXX Bias generating an XIV buy signal on 3-20-15 and our VRP indicator signalling a buy for XIV on 4-1-15.
This month's gains added to already impressive year-to-date returns for our indicators. Indicator performance through April:
- VXX Bias: +51%,
- VRP: +48%
- VRP+VXX Bias: 56%.
The equity curves for each strategy with comparison to XIV are shown in the following graph (the S&P 500 is +1.4% YTD and is not shown):

Trade statistics for each strategy are summarized as follows:

For those interested in additional detail, the daily history of indicator values that have been emailed to subscribers in 2015 can be found in the data sheet links below:
- VXX Bias: 2015
- VRP: 2015
- VRP+VXX Bias: 2015
______
Our daily indicators rode this wave of gains throughout the month on only one trade, with the VXX Bias generating an XIV buy signal on 3-20-15 and our VRP indicator signalling a buy for XIV on 4-1-15.
This month's gains added to already impressive year-to-date returns for our indicators. Indicator performance through April:
- VXX Bias: +51%,
- VRP: +48%
- VRP+VXX Bias: 56%.
The equity curves for each strategy with comparison to XIV are shown in the following graph (the S&P 500 is +1.4% YTD and is not shown):
Trade statistics for each strategy are summarized as follows:
For those interested in additional detail, the daily history of indicator values that have been emailed to subscribers in 2015 can be found in the data sheet links below:
- VXX Bias: 2015
- VRP: 2015
- VRP+VXX Bias: 2015
______
Hypothetical and Simulated Performance Disclaimer
The results are based on simulated or hypothetical performance results that have certain inherent limitations. Unlike the results shown in an actual performance record, these results do not represent actual trading. Also, because these trades have not actually been executed, these results may have under- or over-compensated for the impact, if any, of certain market factors, such as lack of liquidity. Simulated or hypothetical trading programs in general are also subject to the fact that they are designed with the benefit of hindsight. No representation is being made that any account will or is likely to achieve profits or losses similar to these being shown. Additional performance differences in backtests arise from the methodology of using the 4:00pm ET closing values for XIV, VXX, and ZIV as approximated trade prices for indicators that require VIX and VIX futures to settle at 4:15pm ET.
The results are based on simulated or hypothetical performance results that have certain inherent limitations. Unlike the results shown in an actual performance record, these results do not represent actual trading. Also, because these trades have not actually been executed, these results may have under- or over-compensated for the impact, if any, of certain market factors, such as lack of liquidity. Simulated or hypothetical trading programs in general are also subject to the fact that they are designed with the benefit of hindsight. No representation is being made that any account will or is likely to achieve profits or losses similar to these being shown. Additional performance differences in backtests arise from the methodology of using the 4:00pm ET closing values for XIV, VXX, and ZIV as approximated trade prices for indicators that require VIX and VIX futures to settle at 4:15pm ET.
-JW
. . . . . . . . . . . . . .
Stay up to date by having posts sent directly to your
RSS feed or
Email.
Addition of VSTOXX Futures Data Page
To help bring greater visibility into the volatility landscape in Europe's stock market, we have added a page dedicated to VSTOXX Futures.
The VSTOXX index is the 30-day volatility index for the Euro STOXX-50 index, Europe's leading blue-chip index which provides a representation of the major sectors across 18 European countries.
Similar to our VIX Futures page, the VSTOXX Futures page contains quotes, historical volatility data, key metrics, and graphs that are useful in tracking volatility.
-JW
. . . . . . . . . . . . . .
Stay up to date by having posts sent directly to your
RSS feed or
Email.
Our VRP+VXX Bias Indicator +35% in 1st Quarter
The first quarter of 2015 has come to a close and investors everywhere are reviewing their performance. This is the perfect time to evaluate the effectiveness of your investment strategies and to make adjustments accordingly.
Our VXX Bias and VRP indicators have both navigated the first quarter quite well, at +31% and +29% YTD, respectively. These two indicators each provide end-of-day signals for placing swing trades in XIV and VXX (if you're not already familiar with our trading strategies you can learn more about them here).
Our preferred strategy, VRP + VXX Bias, combines the two signals to place trades only when they agree on direction and is +35% YTD.
The graph below tracks the daily values for each of our indicators as well as XIV (buy-and-hold) as a comparison reference point (the usual investment benchmark, the S&P 500, is not included because it is an irrelevant +0.9% YTD).

We kept commission fees low by placing only a half dozen trades in the first quarter. Trade statistics for each strategy are summarized as follows**:

If you're not quite meeting your investment objectives this year perhaps we can help. For less than $3 per day we provide subscribers access to all of our VIX data & metrics, our indicators, automated Bias change alerts, and the members' forum.
--> New in 2015, we will be providing an additional level of visibility into our trading by having our performance verified by a third party (Marketfy). We recently tweeted our YTD portfolio performance of +17.8%, which was obtained by using the VRP+VXX Bias strategy as our guide. Look for additional updates on real-time notifications of our trades in the future.
- VXX Bias: 2015
- VRP: 2015
- VRP+VXX Bias: 2015
______
Hypothetical and Simulated Performance Disclaimer
The results are based on simulated or hypothetical performance results that have certain inherent limitations. Unlike the results shown in an actual performance record, these results do not represent actual trading. Also, because these trades have not actually been executed, these results may have under- or over-compensated for the impact, if any, of certain market factors, such as lack of liquidity. Simulated or hypothetical trading programs in general are also subject to the fact that they are designed with the benefit of hindsight. No representation is being made that any account will or is likely to achieve profits or losses similar to these being shown. Additional performance differences in backtests arise from the methodology of using the 4:00pm ET closing values for XIV, VXX, and ZIV as approximated trade prices for indicators that require VIX and VIX futures to settle at 4:15pm ET.
The results are based on simulated or hypothetical performance results that have certain inherent limitations. Unlike the results shown in an actual performance record, these results do not represent actual trading. Also, because these trades have not actually been executed, these results may have under- or over-compensated for the impact, if any, of certain market factors, such as lack of liquidity. Simulated or hypothetical trading programs in general are also subject to the fact that they are designed with the benefit of hindsight. No representation is being made that any account will or is likely to achieve profits or losses similar to these being shown. Additional performance differences in backtests arise from the methodology of using the 4:00pm ET closing values for XIV, VXX, and ZIV as approximated trade prices for indicators that require VIX and VIX futures to settle at 4:15pm ET.
-JW
. . . . . . . . . . . . . .
Stay up to date by having posts sent directly to your
RSS feed or
Email.
Why (and exactly how much) Your Leveraged ETF Will Underperform
Experienced investors know that owning leveraged ETFs (2x and 3x) leads to decay in the value of the funds. The decay can be so strong that even if you get the direction right you may still end up with a loss. In this post I will quantify the decay on leveraged ETFs to illustrate the dangers of holding these funds.


3) IWM: Actual volatility (HV20) range: 10 - 40


As a brief bit of background, leveraged ETFs seek to return the 2x or 3x the daily return of the underlying security. Below are some examples:
There is actually a known formula (**fellow math nerds can see the formula at the end of this post) for the return of a leveraged ETF. The critical variables that dictate leveraged ETF performance are:
1) The return of the underlying index (e.g. GDX, VXX, IWM)
2) The actual volatility of the underlying index
3) The amount of leverage (e.g. 1x, 2x, 3x)
4) The duration of the holding period
In quantifying the decay of these 2x and 3x ETFs I will start by mapping out #2, which is the actual volatility of the underlying index.
1) GDX: Actual volatility (HV20) range: 20 - 80
2) VXX: Actual volatility (HV20) range: 20 - 130
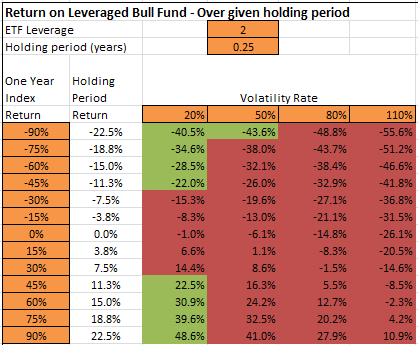
Using this information we can build tables and graphs to capture the various scenarios for the return of the underlying and compare that to the return of the leveraged ETF. (Note: All scenarios below assume a holding period of 3 months. Holding a fund for less than 3 months will see relatively less decay, while holding longer will experience greater decay.)
The return of the underlying index is listed in the first column while the various volatility rates are listed in the top row. The intersection of the index performance and its volatility rate gives the return of the leveraged ETF.
1) NUGT
For example, if GDX returned 5% over the holding period and had a 20% volatility rate, the return of NUGT would be 12.3%. Another scenario would be a holding period return in GDX of -12.5% and a volatility of 60%. This results in a return of -48.9% in NUGT. Note that cells colored red indicate that the leveraged ETF is underperforming 3x of the underlying index, while green cells are outperforming. It should be clear from the above that under most scenarios except for when actual volatility is low, a 3x fund will underperform.
The scenarios in graph above can be drawn in graph form for better understanding. The horizontal axis marks the return of the underlying index (GDX, IWM, etc) and the vertical axis marks the return of the leveraged ETF.
NUGT & TNA:
Leveraged inverse ETFs (DUST & TZA):
UVXY:
Because UVXY is only a 2x leveraged fund we a need different chart. However as shown above, the actual volatility of VXX is much higher as well which changes other input ranges.
The resulting concept is the same however: the higher the actual volatility of the underlying (VXX), the more UVXY will underperform.
Consider someone who expect the market to crash while VIX spikes 80% and VXX spikes 60%. If the underlying volatility of VXX is 80% (which is likely to happen during market crash), UVXY only returns 12.7%. If VXX returned 80% but the actual volatility of VXX is 110% (it saw 120% in fall of 2011), the UVXY return is only -2.3%. Obviously UVXY is a very poor hedge to hold for any significant duration. It is really only beneficial for short duration trades if you have impeccable timing.
Here are the UVXY returns in graphical format:
Don't be lured by the potential return of these leveraged ETF products. Unless actual volatility of the underlying index is very low, you're likely to be just another victim of leveraged ETF decay.
_________
** Return (R) for a leveraged ETF is defined by:
Where x is the leverage ratio, σ is the volatility of the index, and T is the time
period the investment is held (source Cheng and Madhavan (2009) and Wang (2009))
-JW
. . . . . . . . . . . . . .
Stay up to date by having posts sent directly to your
RSS feed or
Email.
Utilizing Two Complementary Strategies to Trade VXX & XIV
In early December we made a second strategy for trading VXX and XIV available to our subscribers: the Volatility Risk Premium (VRP) strategy. You may remember me outlining the excellent performance of this strategy in my previous blog post, Volatility Strategies - Separating Fact From Fiction. I liked the strategy so much I decided to make a few adjustments and launch our own version of VRP to use along with our VXX Bias on our Daily Forecast page.
Why use two strategies for trading volatility ETPs? Because no single strategy is perfect and the market is inherently unpredictable. Using two complementary strategies simultaneously compensates for inherent weaknesses within each of the strategies, reduces drawdowns, and smooths out returns over months and years.
The VXX Bias and VRP strategies each take a very different approach for maximizing gains. The VXX Bias strategy is based on the term structure and momentum of VIX futures, while VRP is based on the price of VIX and historical volatility measurements. However, each of these strategies thrive and struggle depending on the specific market conditions. For example, the VXX Bias strategy has an advantage in handling periods of moderate drawdowns and sustained periods of backwardation. Meanwhile, the VRP strategy tends to be better with choppy markets and periods of gradually increasing volatility when VIX futures are in contango.
You can see in the backtest results below that neither strategy consistently outperforms the other over a given year, although both VXX Bias and VRP are vastly superior to a buy-and-hold approach with XIV.

As you can see in the chart above, using the VRP and VXX Bias strategies together (the green columns) provide more consistent returns than using just one strategy alone. In most years the "VRP + VXX Bias" strategy return falls roughly halfway between the VXX Bias and VRP strategies used on their own. (Note: There are a couple ways to incorporate two strategies, but the easiest way is to trade in VXX or XIV only when they agree on the trade direction, which is how the above results are generated.)
Looking at the strategy statistics below, we see that the VRP + VXX Bias strategy benefits from a reduced maximum drawdown and a 0.90 Sharpe Ratio.

Other relevant stats for trading only when VRP and VXX Bias agree on direction (years 2004-2014):
The equity curve for each of the strategies (below) illustrates the smaller drawdowns and improved performance of using VRP and VXX Bias together:

Table of annual returns for the above data:

Why use two strategies for trading volatility ETPs? Because no single strategy is perfect and the market is inherently unpredictable. Using two complementary strategies simultaneously compensates for inherent weaknesses within each of the strategies, reduces drawdowns, and smooths out returns over months and years.
The VXX Bias and VRP strategies each take a very different approach for maximizing gains. The VXX Bias strategy is based on the term structure and momentum of VIX futures, while VRP is based on the price of VIX and historical volatility measurements. However, each of these strategies thrive and struggle depending on the specific market conditions. For example, the VXX Bias strategy has an advantage in handling periods of moderate drawdowns and sustained periods of backwardation. Meanwhile, the VRP strategy tends to be better with choppy markets and periods of gradually increasing volatility when VIX futures are in contango.
You can see in the backtest results below that neither strategy consistently outperforms the other over a given year, although both VXX Bias and VRP are vastly superior to a buy-and-hold approach with XIV.

As you can see in the chart above, using the VRP and VXX Bias strategies together (the green columns) provide more consistent returns than using just one strategy alone. In most years the "VRP + VXX Bias" strategy return falls roughly halfway between the VXX Bias and VRP strategies used on their own. (Note: There are a couple ways to incorporate two strategies, but the easiest way is to trade in VXX or XIV only when they agree on the trade direction, which is how the above results are generated.)
Looking at the strategy statistics below, we see that the VRP + VXX Bias strategy benefits from a reduced maximum drawdown and a 0.90 Sharpe Ratio.
Other relevant stats for trading only when VRP and VXX Bias agree on direction (years 2004-2014):
- # of trades: 191
- Avg hold time: 9.8 days
- # of days out of market in cash: 821 (out of 2711) --> 30%
- Avg trade return: 5.35%
- Max trade gain: 110.8%
- Max trade loss: -20.3%
The equity curve for each of the strategies (below) illustrates the smaller drawdowns and improved performance of using VRP and VXX Bias together:
Table of annual returns for the above data:
Full test data for both the VRP and VXX Bias strategies can be found in the spreadsheets at the bottom of the Subscribe page. You can also read more about our trading strategy on our Strategy page.
Access to our daily indicators and automated alerts for both the VRP and VXX Bias strategies is available via subscription to Trading Volatility+.
------------
Hypothetical and Simulated Performance Disclaimer
The results are based on simulated or hypothetical performance results that have certain inherent limitations. Unlike the results shown in an actual performance record, these results do not represent actual trading. Also, because these trades have not actually been executed, these results may have under- or over-compensated for the impact, if any, of certain market factors, such as lack of liquidity. Simulated or hypothetical trading programs in general are also subject to the fact that they are designed with the benefit of hindsight. No representation is being made that any account will or is likely to achieve profits or losses similar to these being shown. Additional performance differences in backtests arise from the methodology of using the 4:00pm ET closing values for XIV, VXX, and ZIV as approximated trade prices for indicators that require VIX and VIX futures to settle at 4:15pm ET.
-JW
. . . . . . . . . . . . . .
Stay up to date by having posts sent directly to your
RSS feed or
Email.
2015 CBOE Risk Management Conference - Attendees get 30% off Subscription to Trading Volatility+
CBOE's Risk Management Conference is the premier educational forum for users of volatility products and equity derivatives. It is *the* conference for financial professionals to attend to learn the latest risk management tools and tactics from top traders and strategists.
The next CBOE Risk Management Conference is scheduled for March 4-6 in Carlsbad, California. The agenda is now set with talks from over two dozen industry experts, exploring the latest products, trading strategies and tactics used to manage risk exposure and enhance yields. The full agenda is available here.
As an added bonus, attendees at the March 4-6, 2015 session are able to get a 30% discount* on their first three months of a Trading Volatility+ subscription.
Our Trading Volatility+ service provides access to:
- Our full suite of volatility metrics and indicators to bring you valuable insight into the movement of VIX ETPs,
- Our strategies, which utilize variations on widely-used trading indicators (such as Volatility Risk Premium) as well as our own proprietary algorithms (VXX BiasTM and ZIV BiasTM),
- Our automated alerts which notify subscribers whenever one of our indicators experiences a critical change in direction, making the strategies easy to follow,
- Our members' forum where you can interact and share ideas with other volatility traders.
The unique characteristics and profit potential of VIX futures led to the fifth consecutive annual trading volume record in 2014. 2015 is already looking to break that record again as interest in volatility as a tradable asset continues to grow. If you're still shying away from this well-kept secret of sophisticated investors, now is is the time to learn more. A good place to start is with our concise (and FREE!) e-book, Fundamental Concepts and Strategies for Trading Volatility ETPs.
*Discount available only to new subscribers. The discount will be refunded to subscribers after providing proof of event attendance.
-JW
. . . . . . . . . . . . . .
Stay up to date by having posts sent directly to your
RSS feed or
Email.
Subscribe to:
Posts (Atom)