Our Indicator Performance: +82% YTD Through November

It is time again for a year-to-date performance update of our indicators.

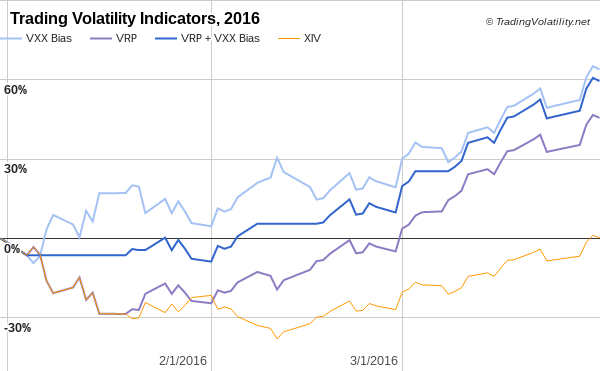
First, we have the hypothetical results using the daily indicators values in our model simulations (using ~100% equity on trades and assuming zero trade commissions). Here is the daily equity curve of all indicators, compared to XIV (buy-and-hold):

As you can see, the YTD performance of our indicators using hypothetical models has come down a bit since our update in July and subsequent peak on September 7th. Despite this lull, 2016 has been a very good year for us. Through November, the performance now sits at:
- VRP+VXX Bias: +82%
- VXX Bias: +122%
- VRP: +7%

For reference, 2016 performance of the publicly-traded "short volatility ETN" (ticker: XIV) and the "long volatility ETF" (ticker: VXX) are at:
- XIV (buy and hold): +69%
- VXX (buy and hold): -65%


Auto-Trade Performance on Collective2
We have tracked our actual trades and performance on Collective2's site since February 2016 (links: VRP+VXX Bias & VXX Bias). Our VRP+VXX Bias and VXX Bias indicators and both 100% automated algorithms which send signals to Collective2's platform for auto-trade execution in our trading account and performance tracking.1

From launch (February 2016) through November, performance on the auto-trade systems sit at:
- VRP+VXX Bias: +65%
- VXX Bias: +83%
- VRP: (not auto-traded)

As of last week, the current cumulative returns for our strategies auto-traded on Collective2 will be updated daily on our Strategy Page.

Compared to the indicators' historical record, 2016 is currently sitting around average for the year. Also posted on our Strategy Page, we have the monthly and annualized statistics for each of our strategies compared to XIV (buy-and-hold):


Trading Volatility+ subscribers have access to our VRP and VXX Bias indicators, our intraday indicator data, receive emails with preliminary and final change alerts for each of the indicators as well as our daily summaries, and interact with our private community of volatility traders in the forum. If interested, you can learn more about our services on our Subscribe page.

As always, each day's indicator values, buy/sell triggers, trade performance summary, and equity curves are tracked in the spreadsheets linked at the bottom of our Subscribe page. Additional information on our trading strategy and indicators can be found on our Strategy page.


1Note: As mentioned in our previous post, you will find differences between the ideal/hypothetical indicator performance and actual trading performance for the following reasons:
- The VRP+VXX Bias indicator ("Trading Volatility 1" on C2) was launched on C2 on Feb 2, 2016.
- The VXX Bias indicator was launched on C2 on Feb 19, 2016
- Both C2 systems traded only 72%-80% of portfolio equity until April 1. After April 1, both C2 systems trade at ~97.5% portfolio equity (the ideal/hypothetical model portfolios trade at 100% equity).
- The ideal/hypothetical performance does not account for trade commissions or subscriptions costs.

------------
Hypothetical and Simulated Performance Disclaimer
The results are based on simulated or hypothetical performance results that have certain inherent limitations. Unlike the results shown in an actual performance record, these results do not represent actual trading. Also, because these trades have not actually been executed, these results may have under- or over-compensated for the impact, if any, of certain market factors, such as lack of liquidity. Simulated or hypothetical trading programs in general are also subject to the fact that they are designed with the benefit of hindsight. No representation is being made that any account will or is likely to achieve profits or losses similar to these being shown. Hypothetical and backtest results do not account for any costs associated with trade commissions or subscription costs. Additional performance differences in backtests arise from the methodology of using the 4:00pm ET closing values for XIV, VXX, and ZIV as approximated trade prices for indicators that require VIX and VIX futures to settle at 4:15pm ET.


. . . . . . . . . . . . . .

Stay up to date by having posts sent directly to your RSS feed or Email.

Our Indicator Performance: +91% YTD Through July

With year-to-date performance numbers that look too good to be true, it's a good thing we started having our actual trades and performance tracked using Collective2's auto-trading capabilities earlier this year.

First, our indicator performance in 2016 (through July):
- VRP+VXX Bias: +91%
- VXX Bias: +142%
- VRP: +16%

Performance in 2016 of the "short volatility ETN" (ticker: XIV) and the "long volatility ETN" (ticker: VXX):
- XIV (buy and hold): +31%
- VXX (buy and hold): -49%

The daily equity curve of all indicators, compared to XIV (buy-and-hold):


Actual Trade Performance
Our VRP+VXX Bias and VXX Bias indicators and both 100% automated algorithms which send signals to Collective2's platform for auto-trade execution in our trading account (NOTE: we do not trade the standalone VRP strategy).

Our actual trades and performance can be found on Collective2's site (links: VRP+VXX Bias & VXX Bias). You will find differences between the ideal indicator performance (above) and actual trading performance for the following reasons:
- The VRP+VXX Bias indicator ("Trading Volatility 1" on C2) was launched on C2 on Feb 2, 2016.
- The VXX Bias indicator was launched on C2 on Feb 19, 2016
- Both C2 systems traded only 72%-80% of portfolio equity until April 1. After April 1, both C2 systems trade at ~97.5% portfolio equity (ideal indicator performance assumes ~100% use of equity).

Compared to the indicators' track record, 2016 has the potential to be an above average year. As posted on our Strategy Page, we have the annual statistics for each of our strategies compared to XIV (buy-and-hold):


We also now track our strategy statistics on a monthly timeframe:


One other observations is that trading has been less active than usual this year with only 7 trades so far for VRP+VXX Bias and 5 trades for VXX Bias.

All-in-all it's been a good year so far. It will be interesting to see how the rest of the year unfolds.


------------
Hypothetical and Simulated Performance Disclaimer
The results are based on simulated or hypothetical performance results that have certain inherent limitations. Unlike the results shown in an actual performance record, these results do not represent actual trading. Also, because these trades have not actually been executed, these results may have under- or over-compensated for the impact, if any, of certain market factors, such as lack of liquidity. Simulated or hypothetical trading programs in general are also subject to the fact that they are designed with the benefit of hindsight. No representation is being made that any account will or is likely to achieve profits or losses similar to these being shown. Additional performance differences in backtests arise from the methodology of using the 4:00pm ET closing values for XIV, VXX, and ZIV as approximated trade prices for indicators that require VIX and VIX futures to settle at 4:15pm ET.


. . . . . . . . . . . . . .

Stay up to date by having posts sent directly to your RSS feed or Email.

Our Indicator Performance: +59% In First Quarter Of 2016

I am proud to announce two of Trading Volatility's achievements for the first quarter of 2016. First, our indicators put in a rather impressive performance to kick off the year. We also launched automated trading for our VRP+VXX Bias and VXX Bias algorithms via Collective2's world-class platform.

First Quarter Indicator Results
The Trading Volatility indicators had a bit of a slow start in the first month of 2016 but rallied strong off of February's market low. Our VRP+VXX Bias indicator finished at +59% for the first quarter of 2016, while our VXX Bias came in at +64%. Our VRP indicator finished the quarter at +46%.

Below is the first quarter equity curve for the Trading Volatility indicators versus XIV (buy and hold):

For those interested in additional details of the indicators, the daily history of indicator values that have been emailed to subscribers in 2016 can be found in the data sheet links below:
- VXX Bias: 2016
- VRP: 2016
- VRP+VXX Bias: 2016


Launch of Auto-Trading
While I'm happy about the performance over the first quarter I'm even happier about the new option of auto-trading our indicators on Collective2's platform. As I announced a couple months ago, you can now have trades automatically placed in your brokerage account whenever the VRP+VXX Bias indicator changes. Since that post, we have added auto-trading for the VXX Bias indicator as well. Both strategies are available on Collective2 at an 85% discount for active Trading Volatility+ subscribers.

I have previously written that the key to successful investing is to have a solid plan as well as the discipline to be able to execute against it. Having our indicators automated does exactly that.

No more worrying about missing trades because I'm too busy.
No more emotional barriers making me wonder if I'm making the right decision to buy or sell.
No more distractions from the noise of daily market movements.
No more being tied to a trading screen all day.

The indicators now execute against the plan automatically and actual trades are tracked on Collective2's site at the following pages: VRP+VXX Bias indicator & VXX Bias indicator

Nothing changes for the existing Trading Volatility+ service. Subscribers will continue to have access to our intraday indicator data, receive emails with preliminary and final change alerts for each of the indicators as well as our daily summaries, and interact with our private community of volatility traders in the forum. If interested, you can learn more about our services on our Subscribe page.

As always, each day's indicator values, buy/sell triggers, trade performance summary, and equity curves are tracked in the spreadsheets linked at the bottom of our Subscribe page. Additional information on our trading strategy and indicators can be found on our Strategy page.


------------
Hypothetical and Simulated Performance Disclaimer
The results are based on simulated or hypothetical performance results that have certain inherent limitations. Unlike the results shown in an actual performance record, these results do not represent actual trading. Also, because these trades have not actually been executed, these results may have under- or over-compensated for the impact, if any, of certain market factors, such as lack of liquidity. Simulated or hypothetical trading programs in general are also subject to the fact that they are designed with the benefit of hindsight. No representation is being made that any account will or is likely to achieve profits or losses similar to these being shown. Additional performance differences in backtests arise from the methodology of using the 4:00pm ET closing values for XIV, VXX, and ZIV as approximated trade prices for indicators that require VIX and VIX futures to settle at 4:15pm ET.


. . . . . . . . . . . . . .

Stay up to date by having posts sent directly to your RSS feed or Email.

Automated Trading For Our VRP+VXX Bias Strategy

By popular request, we have made it dramatically easier for people to trade our leading indicator, the VRP+VXX Bias.

Our VRP+VXX Bias strategy, which returned 36% in 2015, is now available for auto-trading using Collective2's world-class automatic trading platform.

One of the biggest problems for traders and investors is discipline in execution. Scheduling conflicts, emotional barriers, trading fatigue, and lack of confidence can all lead to a deviation from proper trading plan execution. Automation is key in eliminating these common trading pitfalls.

This link is the new home of the VRP+VXX Bias strategy on the Collective2 website where you can follow the trading record, statistics, and a description of the product.

Auto-Trade At An 85% Discount**
Subscribers to our Trading Volatility+ service will receive an 85% discount on the C2 auto-trading service for as long as you remain a Trading Volatility+ subscriber (contact us for a coupon code).

7-Day Free Trial
Sign up at Collective2 for a 7-day free trial with no commitment and see what you think!

More Information On Collective2's Auto-Trading Platform
Collective2's auto-trading platform allows you to have the trades in our strategy mirrored in your own brokerage account. You control the brokerage firm, the trade size, and the ability to intervene to take profits or place your own stops. See here for additional information on their auto-trading and the list of compatible brokers.

Details On Our Automated Trading Plan
The trading execution on the C2 platform utilizes automated buy and sell signals from our VRP+VXX Bias indicator. The following are the detailed mechanics of this automated trading system:
- Trades will be placed at 3:57pm ET if our indicators detect a change in direction.
- Since our VRP+VXX Bias values become official at 4:33pm ET, any discrepancies with the official signal will be resolved at the open of the next trading session.
- This strategy is in 100% cash approximately 30% of the time.
- This strategy typically makes 20-30 trades per year.
- All VXX trades are entered with a 6% stop loss.
- All XIV trades are entered with a 10% stop loss.
- Additional data on our VRP+VXX Bias strategy can be found on our Strategy page.


** Promotional discount offerings subject to change without notice.


. . . . . . . . . . . . . .

Stay up to date by having posts sent directly to your RSS feed or Email.

Our 2015 Indicator Performance: +36%

2015 was a difficult year in the investing world. As it turns out, one of the best performing assets last year was cash since most other asset classes lost money.

According to CNBC, 2015 was the hardest year to make money in 78 years. Investment legends struggled with David Einhorn's Greenlight Capital and Bill Ackman's Pershing Square fund both losing 20%, while average hedge fund performance did not breakeven. In the process, 31 hedge funds shut down during 2015.

It is against this backdrop that we highlight our own struggle in 2015: +36% for our primary indicator (the VRP+VXX Bias).

The end results were respectable, but getting there was anything but easy. The second half of the year was fairly stressful and a bit disappointing given that it was +77% in June. The 2015 equity curve for each of our indicators for trading XIV & VXX, along with XIV's performance, is shown in the following graph.


Drawdowns were painful with VXX Bias experiencing a 43% drawdown in August, fully recovering and hitting a new peak of +94% YTD on September 1st, only to be followed by a 40% drawdown in October. VRP+VXX Bias strategy also experienced a 40% drawdown in the second half of the year and was not able to recapture its +77% high from June before year end.

For the more experienced traders these drawdowns were rather unpleasant. For the uninitiated, the drawdowns were probably enough to make them call it quits. But in the end, it was another year of outperforming just about everything by a large margin with only a couple dozen trades.

In order to compare our results to other known volatility strategies I've included Volatility Made Simple's 2015 performance graph for 24 strategies, below.  Only the VIX vs VXV strategy outperformed our VRP+VXX Bias in 2015, but that strategy's long-term performance remains comparatively poor and suffers from inconsistency (57.6% avg annual return, 0.93 Sharpe ratio, and 70.6% max drawdown).


ZIV Bias Indicator
At -2%, ZIV (the medium-term VIX Futures inverse fund) once again outperformed XIV, which came in at -17% for 2015. While the ZIV Bias indicator was successful in its goal of keeping traders in cash and out of August's major drawdown, it faltered a bit during the choppy trading at the very beginning and end of the year. Ultimately, the ZIV Bias indicator underperformed buy-and-hold this year with a -9%.


As always, each day's indicator values, buy/sell triggers, trade performance summary, and equity curves are tracked in the spreadsheets linked at the bottom of our Subscribe page. Additional information on our trading strategy and indicators can be found on our Strategy page.

Trading Volatility+ subscribers have the benefit of seeing our intraday indicator data, receiving emails with preliminary and final change alerts for each of the indicators as well as our daily summaries, and interacting with our private community of volatility traders in the forum. If interested, you can learn more about our services on our Subscribe page.

2016 is already shaping up to be another exciting year for Trading Volatility. We'd love to have you join us in taking on this difficult market!


------------
Hypothetical and Simulated Performance Disclaimer
The results are based on simulated or hypothetical performance results that have certain inherent limitations. Unlike the results shown in an actual performance record, these results do not represent actual trading. Also, because these trades have not actually been executed, these results may have under- or over-compensated for the impact, if any, of certain market factors, such as lack of liquidity. Simulated or hypothetical trading programs in general are also subject to the fact that they are designed with the benefit of hindsight. No representation is being made that any account will or is likely to achieve profits or losses similar to these being shown. Additional performance differences in backtests arise from the methodology of using the 4:00pm ET closing values for XIV, VXX, and ZIV as approximated trade prices for indicators that require VIX and VIX futures to settle at 4:15pm ET.


. . . . . . . . . . . . . .

Stay up to date by having posts sent directly to your RSS feed or Email.