Showing posts with label FOMC. Show all posts

The Once-A-Decade Volatility Trade

The once-a-decade moment that we as volatility traders look forward to is on the horizon and quickly approaching.

This is a significant change in the market. After all, the majority of our gains here at Trading Volatility have been made by betting on a decline in volatility by buying inverse volatility ETPs, SVXY and XIV, as can be seen in our past performance updates (2013, 2014, 2015, 2016, 2017, 2018 & 2019: see below). The easy money has been made by shorting volatility in this bull market.

The moment I'm referring to is the coming stock correction that has been set up by a a record 12-year bull market and driven volatility levels into the basement. After hitting a low of 8.56 in November 2017, the VIX has been putting in a higher base which now sits near 12.0.


At this point we need to shift gears and be ready for the big gains. I'm talking about the gains that come from being long VXX and often happen in a short period of time. As you can see in the charts below, October 2008 is the best example of what we're about to see (May 2010, Aug 2011, Aug 2015, Feb 2018, Oct 2018, and Dec 2018 are examples of "more ordinary" months with VXX trades). Most people in this market are greedy in buying stocks and now is the time to be looking at taking the other side of the trade and buying volatility. 


Many people have disregarded the warnings about the yield curve inverting as a signal for a recession. However, the reality is that the yield curve has inverted (where 3-month bonds yields are higher than 10-year bond yields) in many countries across nearly every continent in a sign of global recession.  

Dozens of Central Banks are doing their best to fight a recession and spur growth by cutting interest rates. The continuation of falling bond yields around the world, often into negative interest rate territory, signals a world of declining growth. 

Corporate Insiders are selling their stock at a pace not seen since 2007 as doubts about the sustainability of these valuations grow. 

THIS. IS. HAPPENING.

There's just one little problem though.

You can't just sell your stocks to move to cash, buy inverse ETFs or just buy VXX yet. 

Why? Because the Federal Reserve still has the confidence of investors. There are rates to cut and Quantitative Easing to promise and/or deliver, which could drive stocks higher. 

Or not. Maybe market participants get collectively concerned if the Fed sees the situation as dire enough to make big rate cuts and push liquidity into the system as they did in the 2008-2009 financial emergency?  Perhaps we come to realize that the problem is rates are already low due to the inability to raise them from the emergency levels of near 0% set 10 years ago.

Since the timing for a stock correction is difficult to predict, what you can do now is diversify. Carve out a portion of your portfolio and dedicate it to protecting your gains through a form of "tail risk" insurance using volatility. 

"Tail Risk" as most people think of it is generally a losing proposition that can be as simple as buying VXX, UVXY, or TVIX or as involved as buying rolling puts or selling calls on the S&P 500. This is quite simply, a terrible idea. It works maybe once every 10 years, but only to the extent that it would have been better to not do it all. There is a built in Negative Bias against volatility ETFs due to how they are designed -- it is precisely why VXX quickly lost 99% of its value 5 years after the time it was first launched in 2009.

Our form of Tail Risk protection is different because it is dynamically allocated:
  • When there is no immediate danger we are actually short volatility and collecting premiums from all those who are continuously buying protection. It generates gains.
  • Our indicators inform us each day on whether the likelihood of a spike in volatility is significant, and prompts us to move to cash or long volatility when necessary. 
  • By doing this we don't spend money on portfolio hedging when it is unlikely to make money. We only hedge when necessary.  

We've been providing services for applying dynamic volatility positions using strict rule-based decision making to investors for over six years now with an average annual gain of  over 40% per year. 

Our offerings have grown and are now used by people investing small $10,000 accounts and Financial Advisory managing $100,000,000+ in assets. 

Your opportunity is to join us now because once the next volatility spike it's too late. Our gains will be made and those without hedges in place will have lost. It's that simple.

We make it as easy as we can for people to follow our strategies by sending automated signals change alerts, preliminary alerts, and daily summaries.

Check out what we offer to subscribers by viewing our Subscribe page. Considering the information you get from our service, our subscription prices are actually ridiculously cheap. And for those who are afraid of commitment, we offer day passes with full access to our site for as little as $4/day.

To learn more visit our Strategy page. You can also view all the trades that our strategies have generated over the years by looking at the spreadsheets on the Results page or links to Collective2.


Free E-book:
If you'd like to learn more about our how volatility ETFs work you can read our free e-book, Fundamental Concepts and Strategies for Trading Volatility ETPs, which is available for free download. If you are curious about how our Bias forecasts work and why they have been successful in identifying long-term trends under a variety of market conditions, be sure to give this a read. It explains the basic concepts of VIX and VIX futures as well as the main price drivers of various volatility ETPs, including the popular funds VXX, VIXY, SVXY, UVXY, ZIV, and VXZ. I believe that the concepts outlined in the e-book are critical to understand if you're going to trade these products.

------------
Hypothetical and Simulated Performance DisclaimerThe results are based on simulated or hypothetical performance results that have certain inherent limitations. Unlike the results shown in an actual performance record, these results do not represent actual trading. Also, because these trades have not actually been executed, these results may have under- or over-compensated for the impact, if any, of certain market factors, such as lack of liquidity. Simulated or hypothetical trading programs in general are also subject to the fact that they are designed with the benefit of hindsight. No representation is being made that any account will or is likely to achieve profits or losses similar to these being shown. Hypothetical and backtest results do not account for any costs associated with trade commissions or subscription costs. Additional performance differences in backtests arise from the methodology of using the 4:00pm ET closing values for SVXY, VXX, and ZIV as approximated trade prices for indicators that require VIX and VIX futures to settle at 4:15pm ET


. . . . . . . . . . . . . .

Stay up to date by having posts sent directly to your RSS feed or Email.

The Most Important Chart For Trading Volatility ETPs

On April 5, 2014 I wrote an article titled Shorting Volatility: Time To Reduce Profit Expectations for 2014 which outlined why I thought it would be difficult for XIV (the fund which tracks the inverse daily return of volatility futures) to finish positive for 2014. When the article was published XIV had returned an impressive +547% over the past 28 months, as shown in the chart below.


Understandably, many people disagreed with my view, yet XIV finished the 2014 year -9%.

Later in 2014 (September) I wrote The End of an Era for the Market, in which I discussed how a choppy market that is no longer a reliable environment for shorting volatility had become the norm as the Fed concluded their QE program. XIV lost 37% of its value over the next four months and is currently down 30% since that post.

If it wasn't already clear, XIV is not a buy and hold security. It has returned -20% over the past year and -7% over the past two years. The environment is not the same as what it was in 2012 and 2013.

How did I make these calls?

Because returns in XIV are heavily dependent on the Weekly Roll Yield (WRY).

A major factor for the lower returns in the past two years comes from a smaller weekly roll yield that is used to propel XIV. The inverse of the XIV WRY is the VXX WRY (which comes from the difference between first and second month VIX futures). We track this important metric on our site, and as you can see in the graph below, the roll yield has moved from -2% to -1% over the past several years and has recently started to move toward 0%.


This is most important graph because the WRY serves as a headwind or tailwind to VIX ETPs. As the WRY approaches zero, trends become less stable and our advantage in trading XIV or VXX diminishes. Conversely, as the WRY moves away from zero trends become stronger.

Right now there is less of a headwind for VXX and less of a tailwind for XIV/SVXY. At this point in our old bull market we are also at high risk for the VXX WRY turning positive, which would give VXX a tailwind and XIV a headwind.

Revisiting our graph which compares the annual returns of XIV to the average Weekly Roll Yield (below), we can see why the WRY is so important.


Looking at the trendline we can see that with a fairly constant 1% WRY, we can generally expect XIV to return ~+25% per year. As the average WRY moves towards 2% we can expect XIV to return ~+120% per year.  At 0%, XIV is likely to return ~-60%. The recent shrinking of the WRY from 2% to 1% has an enormous impact on returns and that's why it is so important. A continued move of the WRY toward 0% or higher would be alarming to investors who plan to buy-and-hold XIV.

Because the WRY is such an important factor in the performance of VIX ETPs, our approach is to trade XIV and VXX using the WRY as a primary input for our VXX Bias and ZIV Bias indicators (our strategies are outlined here). While XIV is negative on the year, our VXX Bias indicator has put forth a performance of +33% YTD.

No credible trader will ever say that trading is easy, and that is doubly true when it comes to volatility. It requires a deep understanding of market forces, a solid process-oriented plan, and discipline in execution. In the current environment it will be more important than ever to stay on top of changing conditions.

We have been in the business of helping traders stay on top of the volatility market for three years now. We look forward to a fourth year of providing a variety of free data services throughout our website and are always happy to answer questions submitted through our Contact page. We also offer subscriber services to people looking for additional data, metrics, automated alerts and daily summaries, and access to a community of volatility traders. If you're interested, don't hesitate to drop us a line.


------------
Hypothetical and Simulated Performance Disclaimer
The results are based on simulated or hypothetical performance results that have certain inherent limitations. Unlike the results shown in an actual performance record, these results do not represent actual trading. Also, because these trades have not actually been executed, these results may have under- or over-compensated for the impact, if any, of certain market factors, such as lack of liquidity. Simulated or hypothetical trading programs in general are also subject to the fact that they are designed with the benefit of hindsight. No representation is being made that any account will or is likely to achieve profits or losses similar to these being shown. Additional performance differences in backtests arise from the methodology of using the 4:00pm ET closing values for XIV, VXX, and ZIV as approximated trade prices for indicators that require VIX and VIX futures to settle at 4:15pm ET.


. . . . . . . . . . . . . .

Stay up to date by having posts sent directly to your RSS feed or Email.

Historical Context Of The VIX And VIX Futures Super-Cycle

VIX perked up in July as it rose 65% from a low of 10.32 up to over 17 in early August. This translated to gains of almost 30% in VXX, which tracks the daily movement of first and second month VIX futures.

Looking at our chart showing the past six months of VIX and VIX futures movement (from the VIX Futures Data page) there is a pronounced rise in all VIX futures over the month of July, bringing levels back up to those last seen in March.


Market participants have become accustomed to these VIX spikes and stick to a playbook of shorting volatility as it approaches 20. Recently this strategy has worked well but will it always work?

To help answer that question I've created an Archives page dedicated to historical data of VIX futures, containing a visual representation of VIX futures data over the past eight years to document the most recent VIX super-cycle.

On this page you can see how VIX futures traded from the calm market of 2006 through the chaos of 2008, all the way back to the calm of 2014. To give this data some context I've also added a selection of the more significant news events that have impacted the market. This allows you to see when various events happened and how they impacted the market. Some examples covered are:
  • inversion of the bond yield curve in 2006,
  • Bear Stearns downgrade & liquidity rumors,
  • signing of the $700B financial bailout bill (Emergency Economic Stabilization Act of 2008),
  • points when QE1, QE2, and QE3 begin and end,
  • events leading up to the Flash Crash,
  • Greek voters reject ruling parties in elections to put bailout at risk and possibly leave the Euro.

Some of the more enlightening graphs are:

Feb 2007 - Aug 2007 when mortgage defaults were rising as adjustable rate mortgage payments reset. The effect was a 50% rise in front month VIX futures over four months while in a contango term structure.


... Feb 2010 - Aug 2010 as Greece requested a bailout and fear of contagion spread across Europe.


... and Aug 2012 - Feb 2013 which shows the magic moment when the FOMC unveiled its open-ended QE3 program to place the most recent lid over volatility. 


You can view all of the graphs on the Archives page. If you are a Trading Volatility+ subscriber you get the extra benefit of using interactive graphs for your research. If you are interested in becoming a subscriber you can do so at the Subscribe page.


. . . . . . . . . . . . . .

Stay up to date by having posts sent directly to your RSS feed or Email.

A Dose of Reality

Excitement from last week is continuing into this week with spot VIX (+34% today) closing well above front month futures (in fact it closed higher than 6th month futures!), a signal of market instability and a predictor of market sell offs, as I've previously discussed here.

Regardless of the "news events" that pundits say are driving the market, the reality of this market is that the FOMC's attempts to reflate an asset bubble by artificially suppressing interest rates through quantitative easing has forced everyone to chase returns in the stock market using heavy leverage. With ongoing issues of Japan's deflationary problems, Europe's insolvency and unemployment problems, and the U.S.'s deficit problem that no one is truly interested in solving, sooner or later the market will gets a dose of reality when evidence resurfaces to show once more that natural economic growth cycles, which include both growth and recession, cannot be suspended forever.  When that happens it is only natural to see some selling.

While front month VIX futures closed in a very slight backwardation today I am not rushing to buy VXX here. Over the past three days VIX has made an oversized move has risen 29.4% compared to the S&P 500's -1.85% so I will be looking to buy XIV if the market can find some support in the next couple of days.  However with front month VIX only at 17.65 there is no assurance that shorting VIX is a good play just yet. After hitting market highs after 7 straight weeks up we're likely to see choppy trading and an increase in realized volatility as traders look protect profits and perhaps try to unwind some positions.

A couple things to watch out for 1) Bernanke's semiannual testimony on the Monetary Policy Report starts tomorrow at 10:00am ET. A hawkish tone or a hint that QE is at it's useful limits could cause a bearish reaction similar to last Wednesday's selling after the FOMC minutes, and 2) The huge move in the Yen today is likely to crush Japan's stock market tomorrow and may shake investor confidence globally. Should bad news continue and the backwardation spread of M1 and M2 increase I will be long VXX.

A look at today's monster move across VIX futures:


. . . . . . . . . . . . . .

Stay up to date by having posts sent directly to your RSS feed or Email.

Spike in VIX Flattens VIX Futures Term Structure

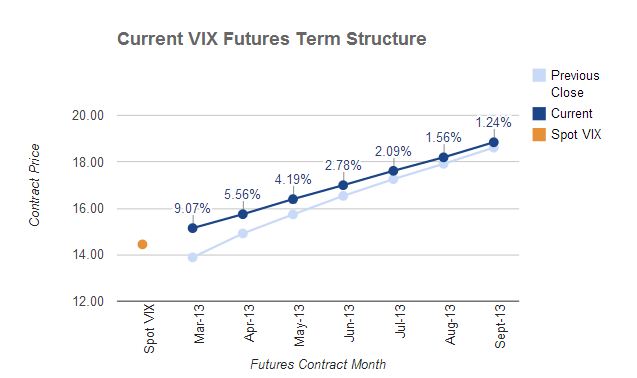
Last Wednesday I discussed how a new VIX futures front month (March) which was priced much higher than forward implied volatility (VIX) and historical volatility would likely cause XIV to continue higher in the short term. After moving up from that time to over 7%  into yesterday's close, XIV pulled back hard today to close down -8.9% as the market sold off a bit and traders started looking for protection with put options with spot VIX moving up 19.25% to close at 14.68 (highest close since 1/2/13).

The VIX futures curve flattened notably today, with front month futures closing just 0.65 below second month futures and the difference between 1st month and 7th month compressed to just 3.7 points. This flattening often indicates that there is imminent downside in the broader market and could move VXX higher and XIV lower (although I don't like long being VXX without backwardation in first two months).

Term structure as of close today:


Coinciding with these technical signals,  the market expressed its displeasure of the FOMC when they suggested that they may need to reduce the $85Billion of QE that goes into the market each month, citing that continued QE may prompt excessive risk and that the economy is on a moderate growth path. But whether the level of QE can actually be reduced without causing an equity market sell off and a costly rise in interest rates remains to be seen.


. . . . . . . . . . . . . .

Stay up to date by having posts sent directly to your RSS feed or Email.

Market Complacency

While most people and the mainstream financial media often look at the spot VIX to gauge the level of fear in the market it really only tells a small part of the story.  The CBOE also provides values for VIX to track the expected volatility for each of the next nine months into the future.

An interesting point and indicator for market complacency is that the sixth month VIX future (May 2013) continues to float near its lowest point (20.5) since Oct 12, 2007 – the day after the S&P 500 hit its all-time high. This suggests that very few traders see a need for protection in the market at these levels, with an assumption that a market-positive fiscal cliff deal will get done, that the sovereign debt issues in Europe are under control, and the belief that the FOMC’s dovish policies will provide continued help for a domestic economic recovery.   While not a signal for a market sell off, it may serve as a good opportunity to pick up some protection in case the market turns down.


. . . . . . . . . . . . . .

Stay up to date by having posts sent directly to your RSS feed or Email.