VXX WRY-10SMA Indicator Updated -- Now the "WRY MACD" Indicator

In late December we introduced a new strategy for trading volatility ETPs which looked at the Weekly Roll Yield ("WRY") for VXX at the end of each day and subtracted it from its 10 day simple moving average. The strategy provides more frequent trading signals than the Bias forecast and can help traders better avoid short-term drawdowns of XIV.

Today I'm excited to announce that we've updated the strategy to reduce the amount of signal noise by utilizing exponential moving averages. The result is 30% fewer trades and substantially improved performance in our backtested performance. The new chart will be published daily at the same location on the VIX Futures Data page.

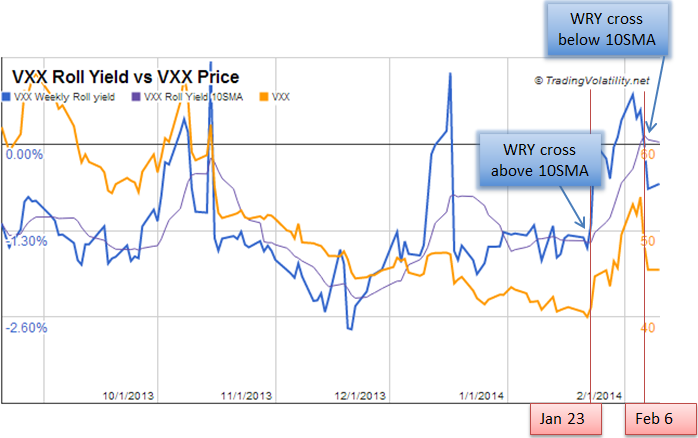
The original WRY-10SMA chart looked like this:


In the new methodology which utilizes the 5EMA and 8EMA of the VXX WRY, the chart looks like this:


As you can see it is a very similar graph, but the WRY moving average lines (blue and purple) are smoother to reduce false signals and choppy trading.

Since we only care about whether the 5EMA is above or below the 8EMA, we've taken the update one step further to help simplify the chart and make it easier to identify when the lines cross. We replaced the two EMA lines with one line, by taking 5EMA minus 8EMA (Note: This is essentially a variant on the standard MACD calculation). Left axis is the MACD signal, while the right axis is VXX price.


Trading Strategy
A positive WRY MACD crossover indicates short-term upward momentum acting on VXX. A negative WRY MACD crossover indicates indicates short-term downward momentum acting on VXX. Therefore, the strategy is to be short VXX (or long XIV/SVXY) when the MACD value is negative, and long VXX when the MACD is positive. The best results in a hypothetical portfolio are obtained by using the WRY MACD indicator along with our Bias forecasts to trade in the same direction of a VIX ETPs current bias. As noted in the announcement of the original version of this strategy (WRY-10SMA), gains from being long VXX when the bias is negative will tend to disappear quickly and sometimes turn into losses so it is usually best to take gains early and/or set trailing stops. Similarly, being short VXX when its Bias is positive and MACD is negative will not produce consistently good results.

Performance Testing
We previously outlined the performance of the WRY-10SMA strategy in this post. The new backtested performance is as follows:

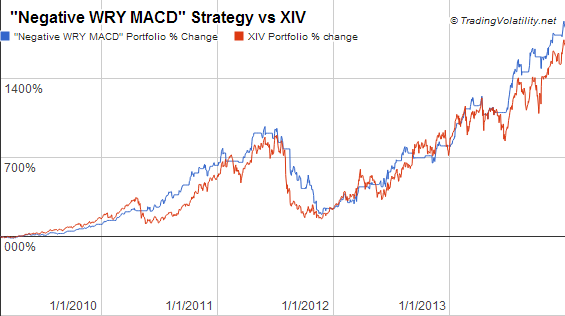
A) Negative WRY MACD, 2013 (Link to Data)


Cumulative Return Jan 1, 2013 - Dec 31, 2013
  • XIV: +107%
  • "Negative WRY MACD": +141%
"Negative WRY MACD" Trade Summary, 2013 
  • # of Gains: 9
  • # of Losses: 5
  • Avg Return: +6.9%
  • Max Gain: +36.0%
  • Max Loss: -6.5%

For the period 2009-2013 the results for the new strategy did not change much versus the WRY-10SMA strategy. Note the undesirable drawdown in the 2nd half of 2011 when trading against a positive VXX Bias. (Link to Data)


B) Positive WRY MACD, 2013


"Positive WRY MACD" Trade Summary, 2013
  • # of Gains: 5 
  • # of Losses: 9 
  • Avg Return: -0.8% 
  • Max Gain: +11.0% 
  • Max Loss: -11.5%


Full data links of backtested results:
Old: WRY 10SMA, 2013 Performance
New: WRY MACD, 2013 Performance

Old: WRY 10SMA, 2009-2013 Performance
New: WRY MACD, 2009-2013 Performance

------------
Hypothetical and Simulated Performance Disclaimer
The results are based on simulated or hypothetical performance results that have certain inherent limitations. Unlike the results shown in an actual performance record, these results do not represent actual trading. Also, because these trades have not actually been executed, these results may have under- or over-compensated for the impact, if any, of certain market factors, such as lack of liquidity. Simulated or hypothetical trading programs in general are also subject to the fact that they are designed with the benefit of hindsight. No representation is being made that any account will or is likely to achieve profits or losses similar to these being shown. Additional performance differences in backtests arise from the methodology of using the 4:00pm ET closing values for XIV, VXX, and ZIV as an approximated trade prices for indicators that require VIX and VIX futures to settle at 4:15pm ET.


. . . . . . . . . . . . . .

Stay up to date by having posts sent directly to your RSS feed or Email.

2014: Is It Still Profitable To Be Short VXX?

The markets are off to a bit of a rocky start to the year, particularly in the last couple of weeks. This is a distinct change of pace after a rather quiet end to 2013. VXX is +6.84% YTD after hitting a high of +30% on Wednesday. Will VXX see another year like 2012 and 2013 with losses of 60%? Or are we likely to see performance closer to 2011?

In this post I'll cover:
  • VIX Technical Review
  • Forecast Review
  • Trading Outlook
  • Trading Plan

VIX Technical Review 
VIX broke out above its 200SMA (14.4) on Jan 24 to start a rally that peaked at 21.48 seven days later. Since then it has quickly retreated and is approaching the 200SMA (now at 14.57) from the other direction. There are some other notable moving averages in the 14.4-14.9 area including the 100SMA, 50SMA, 60EMA, 90EMA and the lower envelope of the 10-2 Bollinger Band, as well as support levels established by previous VIX spikes. This suggests another 5% downside in VIX before support.


Taking a look at VIX futures (chart below), we went into backwardation for a day on Jan 24 and returned for six more days from Jan 30 through Feb 6. This was the longest string of backwardation we've seen since the the Aug 2011 selloff. The impact that backwardation and rising VIX futures have on the price movement of VIX ETF was made clear as XIV fell 30% from its Jan 22 close to its Feb 5 low. Although XIV has recovered somewhat and is down "only" 17% from Jan 22, it is still at risk for further declines should we see a move back to backwardation (also see "XIV: When a 'Sure Thing' Goes Bad").

This was a relatively mild volatility spike with VIX reaching just beyond its long term average of 19.8. Should this move in VIX continue to be more than just a blip on the radar, XIV could see some major losses. We're now back in a slight contango after Friday with Feb at 15.47 and March at 15.88. Feb VIX futures are 1% above spot VIX, which is a very small premium with six trading days left before Feb VIX futures expire. Typically you can expect VIX and expiring VIX futures to remain pretty well coupled as we approach expiration.


Forecast Review
With the expectation for a more dynamic market in 2014, we've been using the signals from our WRY-10SMA indicator in addition to our Bias forecasting signals to guide us in trading. This provides us with additional signals to help avoid short-term drawdowns. After a choppy and sideways January we saw a move in the VXX Weekly Roll Yield above its 10SMA on January 23rd. Combining this with a confirming MACD signal in the VIX on that same day, we went long VXX, selling a potion on the 24th and the remainder on the 27th to lock in 11% gains. This turned out to be premature as the WRY stayed above its 10SMA for 7 more days and an additional 19% gain in VXX, but I find it's always good to take profits in VXX before they disappear. (Note: we will soon be updating our WRY-10SMA indicator to reduce the amount of signal noise by utilizing exponential moving averages.)


Looking at our Bias forecast over the past six months, the negative bias on VXX has been trending smaller resulting in a more difficult short of VXX.


Our VXX Spike Risk forecasts showed a substantially elevated risk over the last few of weeks rising from 25% up to 70%.


Trading Outlook 
First and foremost, let's respect the fact that the market is moving higher, the VXX bias is back to negative, and the VXX WRY is below its 10SMA. Follow this trend and see how we do with the various levels of resistance in the S&P 500 next week (1810 and 1820). Let's also respect the fact that XIV dropped 30% on a modest 5% pullback of the S&P. We are in a relatively old bull market which is rather complacent and investors are heavily leveraged while shorting volatility is a crowded market. We don't yet know if the emerging market issues from the past 2 weeks were just noise or the start of a real problem. When we hit a real problem somewhere down the line VIX will spike quickly and severely and I, for one, don't want to be heavy on the wrong side of the trade when it does.


Trading Plan
Please login to the Members' Forum to finish reading this article. If you're not yet a member you can join via the Subscribe page.


. . . . . . . . . . . . . .

Stay up to date by having posts sent directly to your RSS feed or Email.

Tracking Russell 2000 and NASDAQ 100 Volatility Indices and Futures (RVX and VXN)

We recently expanded our tracking of volatility indices to include the Russell 2000 and NASDAQ 100. Each will be tracked along with the existing S&P 500 volatility (VIX) to provide a better view of these specific areas of the market. 

Page contents:

RVX Futures Data
  • Russell 2000 1-month implied volatility (RVX) and RVX futures
  • Basic RVX futures metrics
  • Russell 2000 historical volatility 
  • RVX futures closing prices over past six months
  • Historical volatility vs implied volatility

VXN Futures Data
  • NASDAQ 100 1-month implied volatility (VXN) and VXN futures
  • Basic VXN futures metrics
  • NASDAQ 100 historical volatility 
  • VXN futures closing prices over past six months
  • Historical volatility vs implied volatility

Data on the RVX futures and VXN futures pages is currently available without the 1-week delay.


. . . . . . . . . . . . . .

Stay up to date by having posts sent directly to your RSS feed or Email.