Showing posts with label VXX. Show all posts

Looking For The Short Volatility Trade After +170% Year-To-Date

Markets have been made historic moves during these first few months of 2020. Here at Trading Volatility we have stayed focused on following the process of our trading systems to get off to an amazing start on the trading year.

Here is the performance of our indicators in 2020, through March 18th, as tracked by a third party (Collective2):

-  VRP+VXX Bias:   +170%


-  VXX Bias:   +238%


Subscribers to these blog posts have known since last September that something like this was coming, as I outlined in "The Once-A-Decade Volatility Trade" post. In that article I wrote

"Your opportunity is to join us now because once the next volatility spike it's too late. Our gains will be made and those without hedges in place will have lost. It's that simple."  

I'm sorry to say that it is now too late for non-subscribers to capture the full extent of this move.

However, there is still an opportunity to capture additional gains on upside from a long volatility trade (via VXX, UVXY, or TVIX) as well as "The Once-A-Decade Short Volatility Trade" which will happen after this current volatility spike runs its course.

In fact, as I've previously written in my Market Crash Protection post, our indicators successfully identify times when the market is strong and it is appropriate to short VXX (or buy an inverse ETF such as SVXY or the much-anticipated SVIX). The short volatility side of the trade is historically where most of our gains come from.

2020 has been a big year on the long volatility side of the trade and I expect it to be just as big on the short volatility side of the trade as we make our way through the Coronavirus (COVID-19) crisis.

These are difficult times and I believe that our automated trading process can be an enormous benefit to anyone who wants to be able to filter out the noise and emotional pitfalls of trading in this market.

As you know, I was not exaggerating when I said we will have the "Once A Decade Volatility Trade" and I am not exaggerating when I say we will have "The Once A Decade Short Volatility Trade."

Join us as a Trading Volatility+ subscriber so this next opportunity doesn't pass you up.


You can view what we offer to subscribers at our Subscribe page. Considering the information you get from our service, our subscription prices are actually ridiculously cheap. And for those who are afraid of commitment, we offer day passes with full access to our site for as little as $4/day.

To learn more visit our Strategy page. You can also view all the trades that our strategies have generated over the years by looking at the spreadsheets on the Results page or links to Collective2. We strive to be as transparent as possible with our service.

Free E-book:
If you'd like to learn more about our how volatility ETFs work you can read our free e-book, Fundamental Concepts and Strategies for Trading Volatility ETPs, which is available for free download. If you are curious about how our Bias forecasts work and why they have been successful in identifying long-term trends under a variety of market conditions, be sure to give this a read. It explains the basic concepts of VIX and VIX futures as well as the main price drivers of various volatility ETPs, including the popular funds VXX, VIXY, SVXY, UVXY, ZIV, and VXZ. I believe that the concepts outlined in the e-book are critical to understand if you're going to trade these products.
------------
Hypothetical and Simulated Performance DisclaimerThe results are based on simulated or hypothetical performance results that have certain inherent limitations. Unlike the results shown in an actual performance record, these results do not represent actual trading. Also, because these trades have not actually been executed, these results may have under- or over-compensated for the impact, if any, of certain market factors, such as lack of liquidity. Simulated or hypothetical trading programs in general are also subject to the fact that they are designed with the benefit of hindsight. No representation is being made that any account will or is likely to achieve profits or losses similar to these being shown. Hypothetical and backtest results do not account for any costs associated with trade commissions or subscription costs. Additional performance differences in backtests arise from the methodology of using the 4:00pm ET closing values for SVXY, VXX, and ZIV as approximated trade prices for indicators that require VIX and VIX futures to settle at 4:15pm ET


. . . . . . . . . . . . . .

Stay up to date by having posts sent directly to your RSS feed or Email.

Day Pass Memberships Now Available for $5

We understand that there are investors who don't have the need for a continuous monthly subscription. For some, the timing for buying and selling volatility ETFs is limited to particular moments where they see an opportunity arise and they are ready to make a trade. Other people just want to access to our set of volatility metrics on occasion when they perceive the market to be at a potential turning point.

I am pleased to announce that you can now purchase a Day Pass to Trading Volatility+ to gain full access to our members-only site at http://members.tradingvolatility.net/ on a non-recurring basis..

Day Passes will provide you with access to:
- The members' Daily Forecast page --  See the current day's indicators as well as the next day's indicators (after 4:33pm ET).
- The members' Intraday Indicators page -- View the indicator values as they update live during regular trading hours.
- Automated change alerts -- Receive an email if there is a buy/sell alert.

Day passes are available at our Subscribe page, with the option to purchase access for 1, 2, 3, 4, or 5 consecutive days (for which the market is open). Each Day Pass is valid from the time it is activated until 11:59pm ET.

Day Passes can be purchased for as low as $4/day**.

For those who may not be familiar with our services, we have offered subscribers a set of buy/sell indicators for volatility ETFs since 2013. Our superior returns were frequently hard to believe so we started having our performance tracked by a third party in 2016.


For more on how our indicators work and can be used, please see our Strategy page. Should you have any questions feel free to reach out to us via our Contact page.


**Pricing for day passes and monthly subscriptions is subject to change.

------------
Hypothetical and Simulated Performance Disclaimer
The results are based on simulated or hypothetical performance results that have certain inherent limitations. Unlike the results shown in an actual performance record, these results do not represent actual trading. Also, because these trades have not actually been executed, these results may have under- or over-compensated for the impact, if any, of certain market factors, such as lack of liquidity. Simulated or hypothetical trading programs in general are also subject to the fact that they are designed with the benefit of hindsight. No representation is being made that any account will or is likely to achieve profits or losses similar to these being shown. Backtest results do not account for any costs associated with trade commissions or subscription costs.  Additional performance differences in backtests arise from the methodology of using the 4:00pm ET closing values for SVXY,  VXX, and ZIV as approximated trade prices for indicators that require VIX and VIX futures to settle at 4:15pm ET.


. . . . . . . . . . . . . .

Stay up to date by having posts sent directly to your RSS feed or Email.

Market Crash Protection

The VXX ETF often gets a bad rap. Throughout this bull market of the past ten years it has seemingly only declined.

But VXX is actually an incredibly useful security to own when equities decline. Consider:

- In February 2018, VXX gained 44% (measured month start to end)
- In Octiober 2018, VXX gained 40%  (measured month start to end)
- In December 2018, VXX gained 36% (measured month start to end)

At this point you have to consider whether a decade-long trend is changing. Take a look at the price of VXX over the past two years:


Obviously there is significant movement in VXX and the key to making money off it is to have the ability to time entries and exits well. Enter our VXX Bias indicator...

Our VXX Bias indicator was first made publicly available in 2013 and has been tracked by a third party (Collective2) since 2016.

A snapshot of our results over that time (below) shows a gain of 348%, thanks largely to huge gains in VXX during the months where equities declined heavily. Specifically:
  • February 2018 (+36%), 
  • October 2018 (+28%), 
  • December 2018 (+21%).


But our strategy doesn't just excel when the equity market does poorly. That's because our VXX Bias signals when to buy VXX as well as when to short VXX. It successfully identifies times when the market is strong and it is appropriate to short VXX (or buy the inverse ETF, ticker SVXY).

Equally significant gains are made by shorting volatility. Specifically:
  • March 2016 (+25%), 
  • May 2016, (+20%), 
  • June 2016 (+34%), 
  • January 2017 (+30%)

I wouldn't fault you for being skeptical of these results since they are outside the norm of what people are told is possible. Which is exactly the reason why I wanted to have the results tracked by a third party over three years ago. People like see actual trades and results. Our customers now include DIYers, Financial Advisors, and hedge funds.

If you look closely at the monthly returns you'll see that we also have months where the strategy does poorly. It should come as no surprise to you that trading is difficult and there is no strategy that works in all market conditions. We typically find ourselves struggling through choppy markets and sharp reversals. We do take losses, for this is not a magic money machine. Fortunately these episodes are relatively brief and our indicator is tuned to maximize profits over the long term.

It has been my honor to have helped thousands of subscribers over the past 6 years. From my initial post in Dec 2012 my mission has been to help investors navigate the use of volatility ETPs and enhance their portfolio returns. We look forward to helping others who can benefit from our expertise.

We make it as easy as we can for people to follow our strategies by sending automated signals change alerts, preliminary alerts, and daily summaries.

Check out what we offer to subscribers by viewing our Subscribe page. Considering the information you get from our service, our subscription prices are actually ridiculously cheap.

To learn more visit our Strategy page. You can also view all the trades that our strategies have generated over the years by looking at the spreadsheets on the Results page or on Collective2.

------------
Hypothetical and Simulated Performance Disclaimer
The results are based on simulated or hypothetical performance results that have certain inherent limitations. Unlike the results shown in an actual performance record, these results do not represent actual trading. Also, because these trades have not actually been executed, these results may have under- or over-compensated for the impact, if any, of certain market factors, such as lack of liquidity. Simulated or hypothetical trading programs in general are also subject to the fact that they are designed with the benefit of hindsight. No representation is being made that any account will or is likely to achieve profits or losses similar to these being shown. Backtest results do not account for any costs associated with trade commissions or subscription costs.  Additional performance differences in backtests arise from the methodology of using the 4:00pm ET closing values for SVXY,  VXX, and ZIV as approximated trade prices for indicators that require VIX and VIX futures to settle at 4:15pm ET.


. . . . . . . . . . . . . .

Stay up to date by having posts sent directly to your RSS feed or Email.

Professional Volatility Strategies

Six years ago on this blog I wrote "XIV: When A "Sure Thing" Goes Bad, highlighting that the key drivers of Volatility ETPs are 1) the change in price of the relevant VIX futures contracts and 2) the term structure. While XIV no longer exists after last year's blow up, the message is still relevant to XIV's reduced leverage replacement, SVXY. In fact, an alternate title for this post could be "When a "Sure Thing" Goes Bad -- SVXY Edition"

Similar to XIV, SVXY is a fund that can be used as a play when an investor believes that volatility will decline. Although SVXY has only half the leverage that XIV had (-0.5x vs -1x), it can still produce strong gains and losses.

Below is a chart of the price of SVXY calculated as if it had the -0.5x leverage since 2004 (prices prior to the fund's official leverage reduction have been constructed by calculating the index value using 1st and 2nd month VIX futures data).


I've highlighted most of the larger price drops to help illustrate that SVXY is not a buy-and-hold security, even in its reduced leverage form. When the market structure changed in 2007 & 2008, SVXY still lost 70% of its value due to strong backwardation in VIX Futures.

As long-time readers know, the term structure of VIX futures is what drives various VIX funds, including SVXY, VXXB, UVXY, TVIX, VIXY, VIIX, and ZIV.

SVXY performs best in years where there is a strong and persistent contango, the condition where VIX is lower than VIX futures. The best way to measure the degree of contango for these products is to look at the weighted value of first and second month VIX futures as compared to spot VIX. Below is a graph of the weighted VIX futures values to spot VIX over the past 11 years.


The trendline here provides a way to filter out the daily noise and allows us to verify that the years in which SVXY performed the best experienced the largest and most persistent contango. On the flip side, the time frames that SVXY performed badly experienced backwardation and/or a small contango.

The fact that the term structure is such a strong driver of VIX ETPs is why professionals track this data closely. We track VIX Futures data and associated metrics shown on our website and use information from the term structure, price momentum, historical volatility, and the volatility of the VIX as inputs to our automated algorithms for buying and selling. The algorithm values are then used to trigger automated buying and selling of VIX ETPs and are emailed to subscribers. We track this data intraday as well and post it to both our Intraday Indicators page as well as our Daily Forecast page.

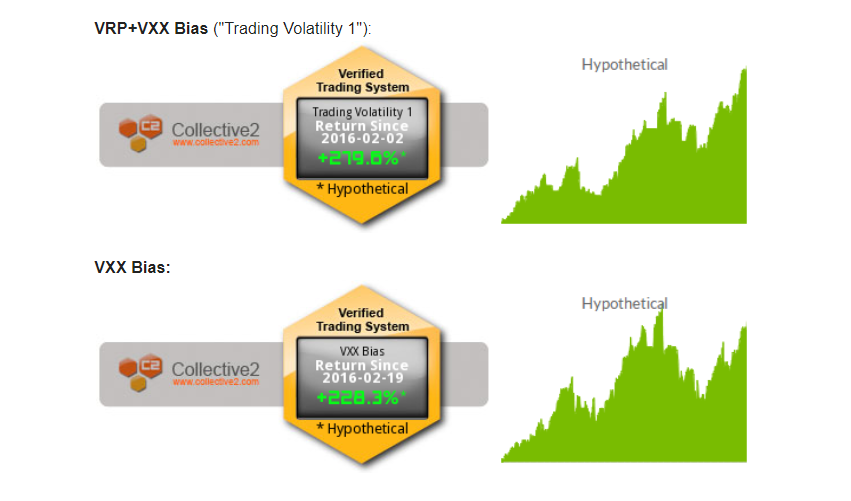
Our results (as tracked by a third party) substantially beat the S&P 500 over the long term. A screenshot of the VXX Bias and VRP+VXX Bias since we began tracking them on Collective2 are shown below:


VXX Bias:


VRP+VXX Bias ("Trading Volatility 1"):


Over the long term our approach can do well in both bull and bear markets, as seen in by our hypothetical backtest summary.


Clearly not all years are huge winners but the data shows that the use of the term structure data tends to be extremely valuable. If you are interested in checking out what we offer to subscribers you can view our Subscribe page.

One more note: We made a change to our VRP indicator in January 2019 so that it can now be used as a standalone strategy. As such, I am now having Collective2 track that as well. It can be found under Enhanced VRP.


------------
Hypothetical and Simulated Performance Disclaimer
The results are based on simulated or hypothetical performance results that have certain inherent limitations. Unlike the results shown in an actual performance record, these results do not represent actual trading. Also, because these trades have not actually been executed, these results may have under- or over-compensated for the impact, if any, of certain market factors, such as lack of liquidity. Simulated or hypothetical trading programs in general are also subject to the fact that they are designed with the benefit of hindsight. No representation is being made that any account will or is likely to achieve profits or losses similar to these being shown. Backtest results do not account for any costs associated with trade commissions or subscription costs.  Additional performance differences in backtests arise from the methodology of using the 4:00pm ET closing values for SVXY,  VXXB, and ZIV as approximated trade prices for indicators that require VIX and VIX futures to settle at 4:15pm ET.


. . . . . . . . . . . . . .

Stay up to date by having posts sent directly to your RSS feed or Email.

Barclays To Replace VXX With VXXB

As planned in the original VXX prospectus from its launch in 2009, VXX will be delisted as a security next week on Jan 30, 2019. Barclays has issued the replacement, VXXB, which is currently trading and is essentially identical to VXX.

To help with the transition, Barclays has published a VXX/VXXB comparison sheet as well as guidance around the transition process.

We have been keeping an eye on the outstanding number of ETNs for both VXX and VXXB over the past month. Very little progress has been made in the transition and VXX continues to hold about 3x the assets of VXXB, with VXX holding $921M as of yesterday.

If VXX's market cap does not come down substantially by Jan 28 there exists a potential for a temporary volatility crash on Jan 29 through Jan 30 as Barclays will need to pay cash out to holders on VXX on Jan 30.

However, as outlined in the guidance document, there exists an option for larger investors to take no action and simultaneously sell positions in VXX and buying equivalents in VXXB and may happen in the last days of VXX trading. This would be the smoothest transition route but it is not clear the percentage of holders will be utilizing this option.


. . . . . . . . . . . . . .

Stay up to date by having posts sent directly to your RSS feed or Email.

Market Trends Point To Another Year of Volatility in 2019

Navigating the stock market in 2017 was easy. Shorting volatility was easy money. Picking individual stocks was easy and everyone was a brilliant strategist.

Then came 2018. The graph below highlights the fact that while less than 2% of assets were negative in 2017, 90% of assets are negative YTD in 2018 -- they highest percentage since... ever.


In another stark contrast to 2017, the short volatility ETPs have lost over 90% of their value in 2018 thanks to February's historic volatility spike. Last year's buy-and-hold everything strategy has been a bust across the board in 2018.

One of the few assets that lost in 2017 was volatility. Unsurprisingly, volatility has been one of the few bright spots in 2018 with the VIX index gaining +74% YTD and VXX +32% YTD.

What sort of market trends appear to be happening now and on tap for 2019?
 - decelerating corporate earnings [now]
 - late stages of the corporate debt cycle [now]
 - decline of demand for U.S. Treasuries [now]
 - quantitative tightening [now]
 - slowing global growth [now]
 - trend of de-dollarization [now]
 - eventual reverse to more quantitative easing [late 2019]

That's a recipe for another difficult year for a range of assets with a strong possibility of wide movements within the equity markets as the year progresses. As we stated three years ago, traders need data-driven, reliable, observable, and easy-to-follow trading rules in order to set themselves up for consistent success. One of the reasons that 90% of people fail to make money at trading is they fail to have a process-oriented trading plan. As the saying goes, "Plan the trade. Trade the plan."

We think that volatility will again be a major factor within the markets in 2019. Our playbook to make money on short-term investing opportunities is to maintain a quantitative-driven investment process for volatility ETPs that has made us successful for the past 7+ years. Specifically, our VXX Bias and VRP indicators.

Why? Because they perform exceedingly well over the long term by trading both long volatility using VXX (soon to be replaced by VXXB) and short volatility using SVXY (previously using XIV).


We've previously noted that 2018 has given us trouble and that hasn't changed much since July. Our automated trading performance as tracked by a third party now stands at -22% for VRP+VXX Bias and +33% for VXX Bias. While the year is not yet over, those numbers are lagging average performance in most years. However, when the average annual return is north of 50% per year under a range of varying market conditions with best performance occurring during market drawdowns, it makes sense to stick with a good thing.

We take the guesswork out of the investing equation with a solid set of objective tools to guide decision making. At Trading Volatility our algorithms conduct daily monitoring of a variety of volatility-related data to generate our VXX Bias and VRP indicators which provide us with objective information about the likely direction of volatility ETPs, including VXX, VXXB, UVXY, TVIX, SVXY and ZIV.

Our algorithms continuously measure market data throughout each trading day and publish results on our subscribers' Intraday Indicator page. Our automation also emails and publishes the indicators' final values at the end of each day so that subscribers' can track the indicator of their choosing and act accordingly.

If you find yourself struggling in this market check us out. Stop guessing what will happen and sign up for our daily data-driven indicators for volatility ETPs.  To learn more visit our Strategy page and Subscribe page or drop us a line via the Contact page.

------------
Hypothetical and Simulated Performance Disclaimer
The results are based on simulated or hypothetical performance results that have certain inherent limitations. Unlike the results shown in an actual performance record, these results do not represent actual trading. Also, because these trades have not actually been executed, these results may have under- or over-compensated for the impact, if any, of certain market factors, such as lack of liquidity. Simulated or hypothetical trading programs in general are also subject to the fact that they are designed with the benefit of hindsight. No representation is being made that any account will or is likely to achieve profits or losses similar to these being shown. Backtest results do not account for any costs associated with trade commissions or subscription costs.  Additional performance differences in backtests arise from the methodology of using the 4:00pm ET closing values for SVXY, VXX, VXXB, and ZIV as approximated trade prices for indicators that require VIX and VIX futures to settle at 4:15pm ET.


. . . . . . . . . . . . . .

Stay up to date by having posts sent directly to your RSS feed or Email.

A Visualization of VIX Implied S&P 500 Movement

U.S. Equities have taken a hit in the first four weeks of October with the S&P 500 declining as much as -9%. The VIX has risen ~108% this month up to 25.23 as of the close yesterday.

As we have noted previously, a VIX of 25 seems a bit low given the magnitude of the daily movements. Below you can see daily S&P 500 returns and their corresponding VIX values on the big sell-off days 10/10/18 (-3.3%) and 10/24/18 (-3.1%).


Based on this historical data, we could reasonably expect VIX to be trading in the 30-45 range. However, the market is apparently not expecting large rallies over the next month.

Recall that the VIX is an expression of expected annualized market volatility over the next 30 days.  A VIX of 25 means annualized move (up or down) of 25%. That value can be converted to monthly terms by dividing by the square root of 12, which yields an expected dispersion of the S&P 500 of 7.2%, or an implied range of 2463-2848.

We can convert that to a weekly and daily basis as well (divide by the square root of 52) to get a weekly dispersion of 3.5%, giving an implied range of 2558 to 2748 from yesterday's close. Interestingly, the 1-week dispersion target for $SPX based on $VIX after Oct 11th was 2820 (it came as high as 2817).

So perhaps $VIX isn't "too low" based on the magnitude of moves. Instead, it's more that investors don't expect a swift rally. Charting out the implied dispersion we can visualize the market's short-term expectations:


We can expect VIX to adjust accordingly as S&P 500 rises and falls. I'll provide updates within the Twitter thread on the subject.


. . . . . . . . . . . . . .

Stay up to date by having posts sent directly to your RSS feed or Email.

Our Indicators Performance Update - YTD Through July 2018

After a strong 2016 (+96%) and 2017 (+126%), our performance in 2018 has been rather lackluster so far.

The biggest difference between this year and previous years is that the short volatility trade isn't working well. We've generally seen small roll yields, choppy market conditions with strong whipsaw reversals, and a VIX that closed the first day of the year with a record low close of 9.77 (47% below the median close on the first day of the year). As you can see in the graph below, the short volatility trade (via buying SVXY) has generally contributed between plus and minus 10% to performance of both indicators all year.


The long volatility trades (via buying VXX) helped the performance for the VXX Bias with YTD returns briefly exceeding 100% after February's historical VIX spike. Despite the initial success however, both VRP+VXX Bias and VXX Bias indicators gave back most of their long volatility gains after February, as shown in the graph below.


Putting both the long and short volatility trades together for 2018 we arrive at the following YTD performance (through July):
  • VRP+VXX Bias: -19%
  • VXX Bias: +37%
  • VRP: -93%
  • SVXY (buy and hold): -89%

This year's journey can be viewed in the equity curves below:


As we did during 2016 and 2017, we continue to send our automated trade alerts to Collective2's auto-trading platform. Below is how our indicators performed, as tracked by Collective2 (performance values and graphs here date back to launch in February 2016).1


Overall, I've been very happy with how the indicators have performed since they were launched on our website back in 2013, but this year has certainly been slow so far -- especially over the last four months. 


As usual, I've updated the values for monthly returns and they have been updated on our Strategy page, as well as below.


Note: Trading Volatility+ subscribers have access to our VRP and VXX Bias indicators, our intraday indicator data, receive emails with preliminary and final change alerts for each of the indicators as well as our daily summaries, and interact with our private community of volatility traders in the forum. If interested, you can learn more about our services on our Subscribe page.

As always, each day's indicator values, buy/sell triggers, trade performance summary, and equity curves are tracked in the spreadsheets linked at the bottom of our Subscribe page. Additional information on our trading strategy and indicators can be found on our Strategy page.

1Note: As mentioned in our previous post, you will find differences between the ideal/hypothetical indicator performance and actual trading performance for the following reasons:
- The VRP+VXX Bias indicator ("Trading Volatility 1" on C2) was launched on C2 on Feb 2, 2016.
- The VXX Bias indicator was launched on C2 on Feb 19, 2016
- Both C2 systems traded only 72%-80% of portfolio equity until April 1. After April 1, both C2 systems trade at ~97.5% portfolio equity (the ideal/hypothetical model portfolios trade at 100% equity).
- The ideal/hypothetical performance does not account for trade commissions or subscriptions costs.

------------
Hypothetical and Simulated Performance Disclaimer
The results are based on simulated or hypothetical performance results that have certain inherent limitations. Unlike the results shown in an actual performance record, these results do not represent actual trading. Also, because these trades have not actually been executed, these results may have under- or over-compensated for the impact, if any, of certain market factors, such as lack of liquidity. Simulated or hypothetical trading programs in general are also subject to the fact that they are designed with the benefit of hindsight. No representation is being made that any account will or is likely to achieve profits or losses similar to these being shown. Hypothetical and backtest results do not account for any costs associated with trade commissions or subscription costs. Additional performance differences in backtests arise from the methodology of using the 4:00pm ET closing values for SVXY, VXX, and ZIV as approximated trade prices for indicators that require VIX and VIX futures to settle at 4:15pm ET.


. . . . . . . . . . . . . .

Stay up to date by having posts sent directly to your RSS feed or Email.

Our 2017 Indicator Performance: +126%

We had a great 2016 with our primary indicator turning in a +96% gain, but 2017 was even better with a +126% gain. It was a bit of a wild journey, however, with a political headlines and threats of nuclear war popping up to cause some pretty strong drawdowns mid-year. Our equity curve for 2017 using hypothetical portfolios is as follows:


Below is how our indicators performed when we sent our trade orders through Collective2's auto-trading platform (performance values and graphs here date back to launch in February 2016), echoing the above equity curves.1

Both our VXX Bias and VRP+VXX Bias strategies were bested by a buy-and-hold approach with XIV in 2017 as it set a new record for best annual return. However, knowing that it is not a good idea to buy and hold XIV, I believe the VRP+VXX Bias performance was still rather good and it helped us to sell when it detected trouble coming our way.


Updated statistics:


Values for monthly returns have been tracked along the way and are updated on our Strategy page as well as below.


Trading Volatility+ subscribers have access to our VRP and VXX Bias indicators, our intraday indicator data, receive emails with preliminary and final change alerts for each of the indicators as well as our daily summaries, and interact with our private community of volatility traders in the forum. If interested, you can learn more about our services on our Subscribe page.

As always, each day's indicator values, buy/sell triggers, trade performance summary, and equity curves are tracked in the spreadsheets linked at the bottom of our Subscribe page. Additional information on our trading strategy and indicators can be found on our Strategy page.

1Note: As mentioned in our previous post, you will find differences between the ideal/hypothetical indicator performance and actual trading performance for the following reasons:
- The VRP+VXX Bias indicator ("Trading Volatility 1" on C2) was launched on C2 on Feb 2, 2016.
- The VXX Bias indicator was launched on C2 on Feb 19, 2016
- Both C2 systems traded only 72%-80% of portfolio equity until April 1. After April 1, both C2 systems trade at ~97.5% portfolio equity (the ideal/hypothetical model portfolios trade at 100% equity).
- The ideal/hypothetical performance does not account for trade commissions or subscriptions costs.

------------
Hypothetical and Simulated Performance Disclaimer
The results are based on simulated or hypothetical performance results that have certain inherent limitations. Unlike the results shown in an actual performance record, these results do not represent actual trading. Also, because these trades have not actually been executed, these results may have under- or over-compensated for the impact, if any, of certain market factors, such as lack of liquidity. Simulated or hypothetical trading programs in general are also subject to the fact that they are designed with the benefit of hindsight. No representation is being made that any account will or is likely to achieve profits or losses similar to these being shown. Hypothetical and backtest results do not account for any costs associated with trade commissions or subscription costs. Additional performance differences in backtests arise from the methodology of using the 4:00pm ET closing values for XIV, VXX, and ZIV as approximated trade prices for indicators that require VIX and VIX futures to settle at 4:15pm ET.


. . . . . . . . . . . . . .

Stay up to date by having posts sent directly to your RSS feed or Email.

Our Indicator Performance: +82% YTD Through November

It is time again for a year-to-date performance update of our indicators.

First, we have the hypothetical results using the daily indicators values in our model simulations (using ~100% equity on trades and assuming zero trade commissions). Here is the daily equity curve of all indicators, compared to XIV (buy-and-hold):

As you can see, the YTD performance of our indicators using hypothetical models has come down a bit since our update in July and subsequent peak on September 7th. Despite this lull, 2016 has been a very good year for us. Through November, the performance now sits at:
- VRP+VXX Bias: +82%
- VXX Bias: +122%
- VRP: +7%

For reference, 2016 performance of the publicly-traded "short volatility ETN" (ticker: XIV) and the "long volatility ETF" (ticker: VXX) are at:
- XIV (buy and hold): +69%
- VXX (buy and hold): -65%


Auto-Trade Performance on Collective2
We have tracked our actual trades and performance on Collective2's site since February 2016 (links: VRP+VXX Bias & VXX Bias). Our VRP+VXX Bias and VXX Bias indicators and both 100% automated algorithms which send signals to Collective2's platform for auto-trade execution in our trading account and performance tracking.1

From launch (February 2016) through November, performance on the auto-trade systems sit at:
- VRP+VXX Bias: +65%
- VXX Bias: +83%
- VRP: (not auto-traded)

As of last week, the current cumulative returns for our strategies auto-traded on Collective2 will be updated daily on our Strategy Page.

Compared to the indicators' historical record, 2016 is currently sitting around average for the year. Also posted on our Strategy Page, we have the monthly and annualized statistics for each of our strategies compared to XIV (buy-and-hold):


Trading Volatility+ subscribers have access to our VRP and VXX Bias indicators, our intraday indicator data, receive emails with preliminary and final change alerts for each of the indicators as well as our daily summaries, and interact with our private community of volatility traders in the forum. If interested, you can learn more about our services on our Subscribe page.

As always, each day's indicator values, buy/sell triggers, trade performance summary, and equity curves are tracked in the spreadsheets linked at the bottom of our Subscribe page. Additional information on our trading strategy and indicators can be found on our Strategy page.


1Note: As mentioned in our previous post, you will find differences between the ideal/hypothetical indicator performance and actual trading performance for the following reasons:
- The VRP+VXX Bias indicator ("Trading Volatility 1" on C2) was launched on C2 on Feb 2, 2016.
- The VXX Bias indicator was launched on C2 on Feb 19, 2016
- Both C2 systems traded only 72%-80% of portfolio equity until April 1. After April 1, both C2 systems trade at ~97.5% portfolio equity (the ideal/hypothetical model portfolios trade at 100% equity).
- The ideal/hypothetical performance does not account for trade commissions or subscriptions costs.

------------
Hypothetical and Simulated Performance Disclaimer
The results are based on simulated or hypothetical performance results that have certain inherent limitations. Unlike the results shown in an actual performance record, these results do not represent actual trading. Also, because these trades have not actually been executed, these results may have under- or over-compensated for the impact, if any, of certain market factors, such as lack of liquidity. Simulated or hypothetical trading programs in general are also subject to the fact that they are designed with the benefit of hindsight. No representation is being made that any account will or is likely to achieve profits or losses similar to these being shown. Hypothetical and backtest results do not account for any costs associated with trade commissions or subscription costs. Additional performance differences in backtests arise from the methodology of using the 4:00pm ET closing values for XIV, VXX, and ZIV as approximated trade prices for indicators that require VIX and VIX futures to settle at 4:15pm ET.


. . . . . . . . . . . . . .

Stay up to date by having posts sent directly to your RSS feed or Email.

Our Indicator Performance: +91% YTD Through July

With year-to-date performance numbers that look too good to be true, it's a good thing we started having our actual trades and performance tracked using Collective2's auto-trading capabilities earlier this year.

First, our indicator performance in 2016 (through July):
- VRP+VXX Bias: +91%
- VXX Bias: +142%
- VRP: +16%

Performance in 2016 of the "short volatility ETN" (ticker: XIV) and the "long volatility ETN" (ticker: VXX):
- XIV (buy and hold): +31%
- VXX (buy and hold): -49%

The daily equity curve of all indicators, compared to XIV (buy-and-hold):


Actual Trade Performance
Our VRP+VXX Bias and VXX Bias indicators and both 100% automated algorithms which send signals to Collective2's platform for auto-trade execution in our trading account (NOTE: we do not trade the standalone VRP strategy).

Our actual trades and performance can be found on Collective2's site (links: VRP+VXX Bias & VXX Bias). You will find differences between the ideal indicator performance (above) and actual trading performance for the following reasons:
- The VRP+VXX Bias indicator ("Trading Volatility 1" on C2) was launched on C2 on Feb 2, 2016.
- The VXX Bias indicator was launched on C2 on Feb 19, 2016
- Both C2 systems traded only 72%-80% of portfolio equity until April 1. After April 1, both C2 systems trade at ~97.5% portfolio equity (ideal indicator performance assumes ~100% use of equity).

Compared to the indicators' track record, 2016 has the potential to be an above average year. As posted on our Strategy Page, we have the annual statistics for each of our strategies compared to XIV (buy-and-hold):


We also now track our strategy statistics on a monthly timeframe:


One other observations is that trading has been less active than usual this year with only 7 trades so far for VRP+VXX Bias and 5 trades for VXX Bias.

All-in-all it's been a good year so far. It will be interesting to see how the rest of the year unfolds.


------------
Hypothetical and Simulated Performance Disclaimer
The results are based on simulated or hypothetical performance results that have certain inherent limitations. Unlike the results shown in an actual performance record, these results do not represent actual trading. Also, because these trades have not actually been executed, these results may have under- or over-compensated for the impact, if any, of certain market factors, such as lack of liquidity. Simulated or hypothetical trading programs in general are also subject to the fact that they are designed with the benefit of hindsight. No representation is being made that any account will or is likely to achieve profits or losses similar to these being shown. Additional performance differences in backtests arise from the methodology of using the 4:00pm ET closing values for XIV, VXX, and ZIV as approximated trade prices for indicators that require VIX and VIX futures to settle at 4:15pm ET.


. . . . . . . . . . . . . .

Stay up to date by having posts sent directly to your RSS feed or Email.

Automated Trading For Our VRP+VXX Bias Strategy

By popular request, we have made it dramatically easier for people to trade our leading indicator, the VRP+VXX Bias.

Our VRP+VXX Bias strategy, which returned 36% in 2015, is now available for auto-trading using Collective2's world-class automatic trading platform.

One of the biggest problems for traders and investors is discipline in execution. Scheduling conflicts, emotional barriers, trading fatigue, and lack of confidence can all lead to a deviation from proper trading plan execution. Automation is key in eliminating these common trading pitfalls.

This link is the new home of the VRP+VXX Bias strategy on the Collective2 website where you can follow the trading record, statistics, and a description of the product.

Auto-Trade At An 85% Discount**
Subscribers to our Trading Volatility+ service will receive an 85% discount on the C2 auto-trading service for as long as you remain a Trading Volatility+ subscriber (contact us for a coupon code).

7-Day Free Trial
Sign up at Collective2 for a 7-day free trial with no commitment and see what you think!

More Information On Collective2's Auto-Trading Platform
Collective2's auto-trading platform allows you to have the trades in our strategy mirrored in your own brokerage account. You control the brokerage firm, the trade size, and the ability to intervene to take profits or place your own stops. See here for additional information on their auto-trading and the list of compatible brokers.

Details On Our Automated Trading Plan
The trading execution on the C2 platform utilizes automated buy and sell signals from our VRP+VXX Bias indicator. The following are the detailed mechanics of this automated trading system:
- Trades will be placed at 3:57pm ET if our indicators detect a change in direction.
- Since our VRP+VXX Bias values become official at 4:33pm ET, any discrepancies with the official signal will be resolved at the open of the next trading session.
- This strategy is in 100% cash approximately 30% of the time.
- This strategy typically makes 20-30 trades per year.
- All VXX trades are entered with a 6% stop loss.
- All XIV trades are entered with a 10% stop loss.
- Additional data on our VRP+VXX Bias strategy can be found on our Strategy page.


** Promotional discount offerings subject to change without notice.


. . . . . . . . . . . . . .

Stay up to date by having posts sent directly to your RSS feed or Email.

Our 2015 Indicator Performance: +36%

2015 was a difficult year in the investing world. As it turns out, one of the best performing assets last year was cash since most other asset classes lost money.

According to CNBC, 2015 was the hardest year to make money in 78 years. Investment legends struggled with David Einhorn's Greenlight Capital and Bill Ackman's Pershing Square fund both losing 20%, while average hedge fund performance did not breakeven. In the process, 31 hedge funds shut down during 2015.

It is against this backdrop that we highlight our own struggle in 2015: +36% for our primary indicator (the VRP+VXX Bias).

The end results were respectable, but getting there was anything but easy. The second half of the year was fairly stressful and a bit disappointing given that it was +77% in June. The 2015 equity curve for each of our indicators for trading XIV & VXX, along with XIV's performance, is shown in the following graph.


Drawdowns were painful with VXX Bias experiencing a 43% drawdown in August, fully recovering and hitting a new peak of +94% YTD on September 1st, only to be followed by a 40% drawdown in October. VRP+VXX Bias strategy also experienced a 40% drawdown in the second half of the year and was not able to recapture its +77% high from June before year end.

For the more experienced traders these drawdowns were rather unpleasant. For the uninitiated, the drawdowns were probably enough to make them call it quits. But in the end, it was another year of outperforming just about everything by a large margin with only a couple dozen trades.

In order to compare our results to other known volatility strategies I've included Volatility Made Simple's 2015 performance graph for 24 strategies, below.  Only the VIX vs VXV strategy outperformed our VRP+VXX Bias in 2015, but that strategy's long-term performance remains comparatively poor and suffers from inconsistency (57.6% avg annual return, 0.93 Sharpe ratio, and 70.6% max drawdown).


ZIV Bias Indicator
At -2%, ZIV (the medium-term VIX Futures inverse fund) once again outperformed XIV, which came in at -17% for 2015. While the ZIV Bias indicator was successful in its goal of keeping traders in cash and out of August's major drawdown, it faltered a bit during the choppy trading at the very beginning and end of the year. Ultimately, the ZIV Bias indicator underperformed buy-and-hold this year with a -9%.


As always, each day's indicator values, buy/sell triggers, trade performance summary, and equity curves are tracked in the spreadsheets linked at the bottom of our Subscribe page. Additional information on our trading strategy and indicators can be found on our Strategy page.

Trading Volatility+ subscribers have the benefit of seeing our intraday indicator data, receiving emails with preliminary and final change alerts for each of the indicators as well as our daily summaries, and interacting with our private community of volatility traders in the forum. If interested, you can learn more about our services on our Subscribe page.

2016 is already shaping up to be another exciting year for Trading Volatility. We'd love to have you join us in taking on this difficult market!


------------
Hypothetical and Simulated Performance Disclaimer
The results are based on simulated or hypothetical performance results that have certain inherent limitations. Unlike the results shown in an actual performance record, these results do not represent actual trading. Also, because these trades have not actually been executed, these results may have under- or over-compensated for the impact, if any, of certain market factors, such as lack of liquidity. Simulated or hypothetical trading programs in general are also subject to the fact that they are designed with the benefit of hindsight. No representation is being made that any account will or is likely to achieve profits or losses similar to these being shown. Additional performance differences in backtests arise from the methodology of using the 4:00pm ET closing values for XIV, VXX, and ZIV as approximated trade prices for indicators that require VIX and VIX futures to settle at 4:15pm ET.


. . . . . . . . . . . . . .

Stay up to date by having posts sent directly to your RSS feed or Email.

The Most Important Chart For Trading Volatility ETPs

On April 5, 2014 I wrote an article titled Shorting Volatility: Time To Reduce Profit Expectations for 2014 which outlined why I thought it would be difficult for XIV (the fund which tracks the inverse daily return of volatility futures) to finish positive for 2014. When the article was published XIV had returned an impressive +547% over the past 28 months, as shown in the chart below.


Understandably, many people disagreed with my view, yet XIV finished the 2014 year -9%.

Later in 2014 (September) I wrote The End of an Era for the Market, in which I discussed how a choppy market that is no longer a reliable environment for shorting volatility had become the norm as the Fed concluded their QE program. XIV lost 37% of its value over the next four months and is currently down 30% since that post.

If it wasn't already clear, XIV is not a buy and hold security. It has returned -20% over the past year and -7% over the past two years. The environment is not the same as what it was in 2012 and 2013.

How did I make these calls?

Because returns in XIV are heavily dependent on the Weekly Roll Yield (WRY).

A major factor for the lower returns in the past two years comes from a smaller weekly roll yield that is used to propel XIV. The inverse of the XIV WRY is the VXX WRY (which comes from the difference between first and second month VIX futures). We track this important metric on our site, and as you can see in the graph below, the roll yield has moved from -2% to -1% over the past several years and has recently started to move toward 0%.


This is most important graph because the WRY serves as a headwind or tailwind to VIX ETPs. As the WRY approaches zero, trends become less stable and our advantage in trading XIV or VXX diminishes. Conversely, as the WRY moves away from zero trends become stronger.

Right now there is less of a headwind for VXX and less of a tailwind for XIV/SVXY. At this point in our old bull market we are also at high risk for the VXX WRY turning positive, which would give VXX a tailwind and XIV a headwind.

Revisiting our graph which compares the annual returns of XIV to the average Weekly Roll Yield (below), we can see why the WRY is so important.


Looking at the trendline we can see that with a fairly constant 1% WRY, we can generally expect XIV to return ~+25% per year. As the average WRY moves towards 2% we can expect XIV to return ~+120% per year.  At 0%, XIV is likely to return ~-60%. The recent shrinking of the WRY from 2% to 1% has an enormous impact on returns and that's why it is so important. A continued move of the WRY toward 0% or higher would be alarming to investors who plan to buy-and-hold XIV.

Because the WRY is such an important factor in the performance of VIX ETPs, our approach is to trade XIV and VXX using the WRY as a primary input for our VXX Bias and ZIV Bias indicators (our strategies are outlined here). While XIV is negative on the year, our VXX Bias indicator has put forth a performance of +33% YTD.

No credible trader will ever say that trading is easy, and that is doubly true when it comes to volatility. It requires a deep understanding of market forces, a solid process-oriented plan, and discipline in execution. In the current environment it will be more important than ever to stay on top of changing conditions.

We have been in the business of helping traders stay on top of the volatility market for three years now. We look forward to a fourth year of providing a variety of free data services throughout our website and are always happy to answer questions submitted through our Contact page. We also offer subscriber services to people looking for additional data, metrics, automated alerts and daily summaries, and access to a community of volatility traders. If you're interested, don't hesitate to drop us a line.


------------
Hypothetical and Simulated Performance Disclaimer
The results are based on simulated or hypothetical performance results that have certain inherent limitations. Unlike the results shown in an actual performance record, these results do not represent actual trading. Also, because these trades have not actually been executed, these results may have under- or over-compensated for the impact, if any, of certain market factors, such as lack of liquidity. Simulated or hypothetical trading programs in general are also subject to the fact that they are designed with the benefit of hindsight. No representation is being made that any account will or is likely to achieve profits or losses similar to these being shown. Additional performance differences in backtests arise from the methodology of using the 4:00pm ET closing values for XIV, VXX, and ZIV as approximated trade prices for indicators that require VIX and VIX futures to settle at 4:15pm ET.


. . . . . . . . . . . . . .

Stay up to date by having posts sent directly to your RSS feed or Email.