However, not many people know about VVIX, which is the volatility index for VIX. Using similar methodology, VVIX provides a measure of the expected dispersion of the VIX over the next 30 days.
On Sept 20th I tweeted this chart about VVIX, which identified concerns about the market. Most people, including traders who spend a great deal of time in the volatility world, pay little or no attention to VVIX. However the gauge is actually quite useful to those who take the time to study its behavior and I'll discuss a couple of entry-level points in this post.
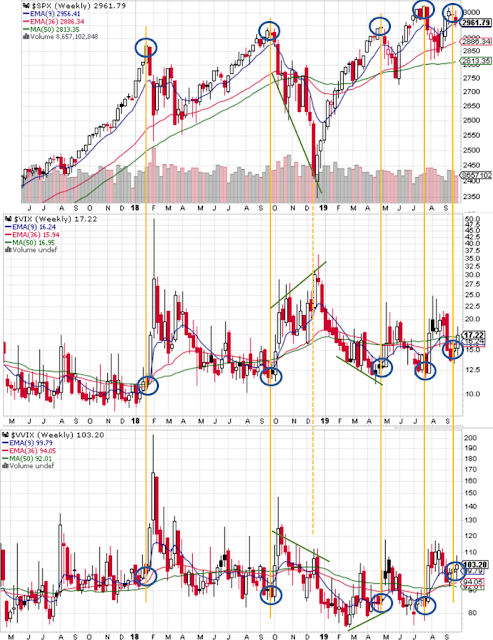
I like to refer to VVIX as the "panic gauge" since it tends to spike to its highs as the VIX moves higher. Generally VIX and VVIX move in the same direction, but when VVIX diverges from VIX it can provide useful information about market conditions. I'll provide some examples of what to look for using the following weekly charts which show the S&P 500 (top graph), VIX (middle graph), and VVIX (bottom graph) over the past 30 months.
First note how VIX and VVIX are generally moving the opposite direction of the S&P 500. This is by no means a law and it is quite possible that all could move the same direction (that explanation will have to be a topic for another day). However it is always important to note when the indices are not moving in their typical inverse correlation manner so that the behavior can be explored.
I've circled recent S&P 500 highs (Jan 2018, Sep 2018, Apr 2019, Jul 2019, and Sept 2019) in blue and lined up the corresponding VIX and VVIX values (yellow lines). I've also used green support lines to indicate times where SPX, VIX, and VVIX are diverging from their typical behavior.
Note that at most of these times where SPX was at or near all-time-highs, VIX and VVIX were near recent lows. But the subtle difference in Sept 2019 was a VVIX at 100 is roughly 25% higher than it should have been given S&P 500 highs and a VIX of only 15.
Note that at most of these times where SPX was at or near all-time-highs, VIX and VVIX were near recent lows. But the subtle difference in Sept 2019 was a VVIX at 100 is roughly 25% higher than it should have been given S&P 500 highs and a VIX of only 15.
That 25% difference in VVIX (a reading of 100 versus an 80) is not trivial and has a specific and direct impact on the price of VIX calls by nearly doubling their price. So what we had the week of September 16th were large investors showing up to pay a 90% premium for portfolio hedging via VIX calls (this premium was demanded by sellers of the VIX calls), and thus the reason for concern.
VIX spiked 40% and the S&P 500 fell nearly 5% over the following 2 weeks after I posted the VVIX chart.
VIX spiked 40% and the S&P 500 fell nearly 5% over the following 2 weeks after I posted the VVIX chart.
Another way, VVIX can be useful in detecting tradable market bottoms. When VVIX does not confirm with higher highs while VIX moves higher, it is often a sign that panic is subsiding and large buyers are stepping in (see dashed line at Dec 2018). As VIX spiked higher to 35, VVIX diverged from its October peak of 150 and only reached a December high of 112. This was a signal that investors had already sufficiently hedged their portfolios and VIX calls were no longer in demand, i.e., the "panic" was over although "fear" was still elevated.
There are many nuances around VVIX which require close inspection. You can look specifically at the implied volatility on VIX options to gain additional insight whether VIX is skewed to the upside or downside. This can be done by looking at your broker's option data or by looking at the data on our new (Free) Skew Charts Page. As an example, the current VIX skew looks like this. showing a high premium for upside VIX calls.
There are many nuances around VVIX which require close inspection. You can look specifically at the implied volatility on VIX options to gain additional insight whether VIX is skewed to the upside or downside. This can be done by looking at your broker's option data or by looking at the data on our new (Free) Skew Charts Page. As an example, the current VIX skew looks like this. showing a high premium for upside VIX calls.
I invite you to visit the page and look at the current VIX skew or skew for any other stock with options. As always don't hesitate to Contact Us with any questions.


