

I was invited to join Bob Lang (options trading mentor at http://explosiveoptions.net, contributor to http://thestreet.com, and one of Jim Cramer's go-to technical experts on Mad Money) in a webinar yesterday. The recorded video has been posted online for anyone interested.
We had a great conversation, covering a wide variety of topics in 80 minutes. To help you find topics of interest, I've outlined our discussion along with approximate minute marks.
- Show intro (0:00)
- Bob's current market analysis (1:50)
- Into of Jay (10:15)
- Overview of Volatility (13:25)
- Role of actual market volatility in pricing of forward looking volatility (VIX) (17:18)
- What happens during recent, brief VIX spikes which quickly revert; impact of QE (24:00)
- Common misconceptions of VXX (30:28)
- Reasons for large blocks of VIX calls (36:15)
- Reason why actual volatility may be higher than implied volatility (39:40)
- Reasons for a rising VIX while the market is rising (41.45)
- Likelihood of seeing a VIX in the 90s again (45:00)
- Reasons for current low VIX regime (47:50)
- Recent pattern of buying XIV on dips and likelihood of continuation of this pattern (51:05)
- Letting data guide trading decisions (53:25)
- XIV technical analysis -- importance of 200-day moving average (54:40)
- XIV indicators (57:30)
- Possibility of rally in XIV in today's market & levels to watch for Friday (1:00:10)
- Do VIX levels have influence on whether equities go up or down (1:02:00)
- Preparing for Black Swan events (1:03:45)
- Current decision making for trading XIV in market Friday (1:08:00)
- Signals for start of new rally in XIV (1:10:30)
- Why Thursday's move in XIV was an indicator that VIX was overbid (1:11:45)
- Tour of free resources at http://tradingvolatility.net (1:14:00)
If you are interested in learning more about trading options from a technical expert, check out Bob's website at http://explosiveoptions.net/ and follow him on Twitter at @aztecs99.
Showing posts with label historical volatility. Show all posts
Showing posts with label historical volatility. Show all posts
Link to Recording of Webinar with Bob Lang and Jay Wolberg
-JW
. . . . . . . . . . . . . .
 Stay up to date by having posts sent directly to your
RSS feed or
Email.
Stay up to date by having posts sent directly to your
RSS feed or
Email.

Objective Signals For Trading VXX, UVXY, and XIV
The market made an impressive run in May with the S&P 500 hitting new all-time highs at 1955.55 and the VIX touching 10.73. With each passing day during this run it seemed there was yet another article claiming that the market is too high or the VIX too low. With actual volatility of the S&P 500 over the past month just 6.42, a VIX in the 10-12 range makes some sense. But rather than speculate on where the VIX should be, the more profitable question is how to trade the volatility ETPs at these levels.
It's dangerous for investors to speculate on where the market will go next without a solid set of objective tools to guide decision making. At Trading Volatility we rely on our proprietary Bias and Spike Risk indicators to provide us with objective information about the likely direction and momentum of volatility ETPs such as VXX, UVXY, TVIX, XIV, SVXY and ZIV. The daily signals from our indicators make it possible to substantially outperform the market and today I'll provide a closer look at these signals.
VXX Bias Forecast
After the close on each market day our algorithms generate the Bias and Spike Risk forecasts for the following day and publish the data on our Daily Forecast page. We track all of our forecasts and compare the values to the actual movement of VXX, as shown in the graph of our forecasts over the past six months, below.

Here I've highlighted two distinct periods. The first is from Jan 24th to April 28, a three-month period in which the VXX Bias forecast (the blue line, using the left axis) stayed slightly negative with a handful of moves to a positive Bias. This block of forecasts provides us with an indication that there is no real advantage in shorting VXX (or buying the inverse, XIV) given that there is no directional Bias to help us in our trade. While VXX (red line, using the right axis) did see some price spikes during this time, they were short-lived as the Bias failed to remain positive.
Looking at the second period from April 29 to June 11, the VXX Bias was more solidly negative with Bias reading between -1 and -2. These readings told us that the wind was at our back to short VXX (or buy XIV) as VXX fell over 25% during this time. As of the evening of June 11, the VXX Bias jumped back up toward zero remaining just slightly negative, to once again let us know that it is time to be a bit cautious shorting volatility.
VXX Spike Risk Forecast
The VXX Spike Risk forecast provides us with information on the probability of a VXX spike (for our purposes, a "spike" is defined as a move of 7% or more over the next two trading days). As with the VXX Bias, we track our daily Spike Risk forecasts against the percent change of VXX for each day. The graph below captures forecasts vs actuals for the last six months.

We've only seen one period of sustained VXX Spike Risk (blue line, using the left axis) above 50%, which took place in late January/early February when we saw the big upward +30% move in VXX. Other than that we've only seen a handful of forecasts reaching above 40%. Looking at the recent period from 4/22 to 6/10 you can see a string of low Spike Risk forecasts below 28% and as low as 16%, indicating time to be a bit more aggressive in shorting VXX. This worked out very well as the price of VXX fell on almost every day during this period (red line, using the right axis). For June 12 we saw a Spike Risk of 49% on a day when VXX gained 6.5% intraday, and today's forecast (June 16) was back up to 48%, once again indicating that we need to be more cautious.
The market provides subtle clues for what the it might do next. As you have now seen, we incorporate these clues into our algorithms to generate what we believe are the best indicators available. If you find yourself struggling in this market check us out. To learn more visit our Subscribe page or drop us a line via the Contact page.
It's dangerous for investors to speculate on where the market will go next without a solid set of objective tools to guide decision making. At Trading Volatility we rely on our proprietary Bias and Spike Risk indicators to provide us with objective information about the likely direction and momentum of volatility ETPs such as VXX, UVXY, TVIX, XIV, SVXY and ZIV. The daily signals from our indicators make it possible to substantially outperform the market and today I'll provide a closer look at these signals.
VXX Bias Forecast
After the close on each market day our algorithms generate the Bias and Spike Risk forecasts for the following day and publish the data on our Daily Forecast page. We track all of our forecasts and compare the values to the actual movement of VXX, as shown in the graph of our forecasts over the past six months, below.
Here I've highlighted two distinct periods. The first is from Jan 24th to April 28, a three-month period in which the VXX Bias forecast (the blue line, using the left axis) stayed slightly negative with a handful of moves to a positive Bias. This block of forecasts provides us with an indication that there is no real advantage in shorting VXX (or buying the inverse, XIV) given that there is no directional Bias to help us in our trade. While VXX (red line, using the right axis) did see some price spikes during this time, they were short-lived as the Bias failed to remain positive.
Looking at the second period from April 29 to June 11, the VXX Bias was more solidly negative with Bias reading between -1 and -2. These readings told us that the wind was at our back to short VXX (or buy XIV) as VXX fell over 25% during this time. As of the evening of June 11, the VXX Bias jumped back up toward zero remaining just slightly negative, to once again let us know that it is time to be a bit cautious shorting volatility.
VXX Spike Risk Forecast
The VXX Spike Risk forecast provides us with information on the probability of a VXX spike (for our purposes, a "spike" is defined as a move of 7% or more over the next two trading days). As with the VXX Bias, we track our daily Spike Risk forecasts against the percent change of VXX for each day. The graph below captures forecasts vs actuals for the last six months.
We've only seen one period of sustained VXX Spike Risk (blue line, using the left axis) above 50%, which took place in late January/early February when we saw the big upward +30% move in VXX. Other than that we've only seen a handful of forecasts reaching above 40%. Looking at the recent period from 4/22 to 6/10 you can see a string of low Spike Risk forecasts below 28% and as low as 16%, indicating time to be a bit more aggressive in shorting VXX. This worked out very well as the price of VXX fell on almost every day during this period (red line, using the right axis). For June 12 we saw a Spike Risk of 49% on a day when VXX gained 6.5% intraday, and today's forecast (June 16) was back up to 48%, once again indicating that we need to be more cautious.
The market provides subtle clues for what the it might do next. As you have now seen, we incorporate these clues into our algorithms to generate what we believe are the best indicators available. If you find yourself struggling in this market check us out. To learn more visit our Subscribe page or drop us a line via the Contact page.
-JW
. . . . . . . . . . . . . .
Stay up to date by having posts sent directly to your
RSS feed or
Email.
Say Hello To The New Uptrend In VIX And VIX Futures
Recap of the Week: 4/7/14 - 4/11/14
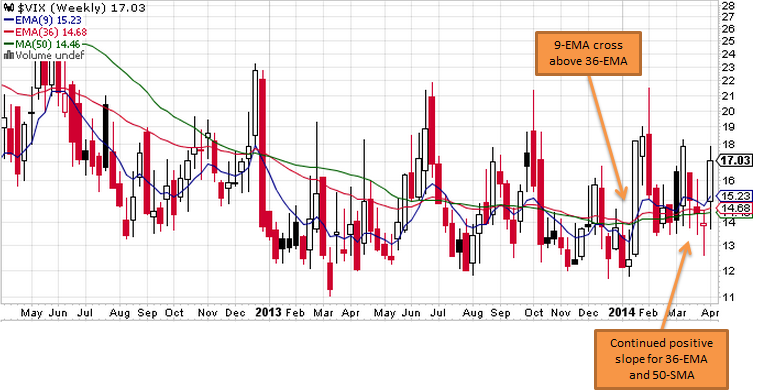
We saw a bit of weakness in the market last week with SPX down 3 of 5 days. VIX largely took the movement in stride, indicating that market participants continue to believe that dips will be bought, or at least, that this particular dip will be bought. We saw a signal to sell XIV / buy VXX on 4/10 as the VXX Bias and WRY MACD moved to positive on Thursday. The next day we saw VIX move as high as 17.85, before closing at 17.03 (+7%). This value of VIX is unusually low for a situation where SPX lost 3% over the course of 2 consecutive days (actual volatility for the week was 19.5). A VIX in the low/mid-20s would be more appropriate given historical comparisons (see this tweet after this Thursday's 2% sell off). No, the VIX is not "broken" here -- this just indicates that market participants do not see the need to buy puts to hedge their positions since the market has been in the pattern of quickly recovering from 5% dips in this new QE era.
Key Points & Outlook
- After a false break lower the week of 3/31 - 4/4, VIX opened up higher this week, retraced to last week's close by Wednesday, then continued up to close at a 4-week high. This kept the longer-term uptrend that started the week of 1/21/14 intact. VIX weekly chart, below, shows the 9-ema rise above the 36-ema and test it twice so far. Also note the positive slope of the 36-EMA and 50-SMA.
- (Remaining Key Points & Outlook are available to Members only. Please login to the Members' Forum to read the remainder of this article. If you're not yet a member you can join via the Subscribe page.)
.
.
Major Shifts In Volatility Structure
We've watched many significant developments in the world of VIX and VIX futures unfold over the past two months and have been discussing these events and their implications in our Members' Forum. Below I've jotted down a summary of points from our recent posts to provide a glimpse of these conversations.
We've watched many significant developments in the world of VIX and VIX futures unfold over the past two months and have been discussing these events and their implications in our Members' Forum. Below I've jotted down a summary of points from our recent posts to provide a glimpse of these conversations.
(You can get access to the Trading Volatility Forum as well as our VIX Futures data and analytics for just $40/month. See the Subscribe page for details.)
2/24/14 - Theme: Rising actual volatility (HV20 & HV60) in the S&P 500 is a sign of an aging market and signifies shifting market sentiment.
- VIX has shown a bit of reservation over the latest two week rally.
- Do not expect XIV to behave in the same way in 2014 as it did in 2013; Expect choppy trading and weaker bounces like what we are seeing now.
2/28/14 - Theme: Disappearance of the roll yield and a higher VIX base
- VIX has shown a bit of reservation over the latest two week rally.
- Do not expect XIV to behave in the same way in 2014 as it did in 2013; Expect choppy trading and weaker bounces like what we are seeing now.
2/28/14 - Theme: Disappearance of the roll yield and a higher VIX base
- VXX Bias has narrowed -- almost no negative roll yield in VXX since early Feb
- VIX making higher lows, forming base in 14s
- Near-term VIX futures not selling off this time around. Trending up since Feb 18.
- Investors not selling VIX futures this time around
3/18/14 - Theme: Market Indecision and VIX Doubt In The Latest S&P Rally
- VXX Bias remains thinly negative
- VIX indicating lingering uncertainty despite S&P rally
- Continued rise in level of actual volatility in SPX, specifically HV60
- VIX/VXV bouncing above & below 0.92 threshold, indicating a high level of indecision
- VIX/VXV bouncing above & below 0.92 threshold, indicating a high level of indecision
3/28/14
- Continued indecision with VIX range-bound
- Watch for development of more negative VXX Bias
- Watch for development of more negative VXX Bias
3/31/14
- Break of the VXX trendline indicates lower prices to come
4/3/14
- Weak market action in NDX and Russell 2000 prompts reduction in XIV position. Not a good time to aggressively short
4/4/14
- No show of fear yet despite selling in SPX. Watch out for further downside on Monday (4/7),
4/10/14
- Change in VXX Bias and WRY MACD signal a move higher in VXX.
-JW
. . . . . . . . . . . . . .
Stay up to date by having posts sent directly to your
RSS feed or
Email.
Shorting Volatility: Time To Reduce Profit Expectations for 2014
With XIV down 7.6% so far this year after seeing 100%+ annual returns in both 2012 and 2013, many have been asking "Is the short volatility trade dead in 2014?" While my terse answer is "not necessarily," we need to take a closer look at the various aspects of the VIX futures market in order to gain some insight on where VIX ETFs could be headed.
The idea of reduced profit expectations for XIV is actually not new. Although XIV gained 107% in 2013, its gains have slowed to just +36% over the past 12 months. While we've talked about this several times last year (here and here and here), today we'll talk about why and take a look at the current outlook.
VIX Futures
The daily price movement of XIV/SVXY, VXX and UVXY/TVIX are determined by the price of the front two months of VIX futures. In the chart below you can see both front month (M1) and second month (M2) VIX futures over the past 12 months.

Current values of M1 (14.85) and M2 (15.75) are generally in the lower-middle portion of the range. We've seen these M1 & M2 price levels with a similar ~1 point spread before. In fact, M1 and M2 are essentially unchanged from 12 months ago and we've seen the same levels six other times during the past year (4/26, 7/29, 9/16, 10/30, 12/3, and 12/19). On all of these occasions we've seen M1 and M2 continue to fall, providing an average gain for XIV of 9% over the next 1-2 weeks. These gains tend to be short-lived as multi-day volatility spikes have resulted in 15%+ drawdowns in XIV for 5 of the 7 instances (exception were 10/30/13 and 12/3/13). This doesn't mean that the same thing will happen this time around, but it does provide some interesting data points.
We can see these moves reflected in the 1-year chart of XIV, below. While VIX futures are essentially unchanged over the past 12 months, monthly expiring futures and the roll yield continue to provide fuel for gains in XIV, which is +36% over the past 12 months (and VXX is -47%). There's no reason this dance can't continue at this "slower" rate as long as M1 and M2 remain range bound under 20, but periodic drawdowns are likely to continue resulting in choppy trading.

As a relevant side note, 3 month actual volatility in the S&P 500 (HV60) has risen about 1.3 points over the course of the past five months. This often serves as an approximate lower-bounds for VIX, as we can see in the HV-IV chart below (see green circles). This means VIX is less likely to soon push back down into the 11.9/12.3 range we saw late last year.

VXX Roll Yield
In addition to looking at the relative position of front month VIX futures, we need to also look at the headwind/tailwind for the securities that arises from the roll yield. The roll yield is proportional to the difference between the 1st and 2nd month VIX futures. Below I've charted VXX's weekly roll yield (WRY) over the past two years.

You can see how the roll yield for VXX has been much less negative so far this year, providing for less of a headwind for VXX and less of a tailwind for XIV/SVXY. In fact, so far this year the average VXX WRY has been just -0.7% (which is +0.7% for XIV). To put that number in context, below is a table of the average XIV weekly roll yield for each of the past 9 years.
XIV: Average Weekly Roll Yield vs. Annual Return
The 2014 average WRY is more or less in the middle of the range between the low (-0.6%) and high (+2.1%). So why is this important? Because the return of VIX ETFs is largely dependent on the roll yield. as illustrated by a scatter plot for the above table.

You can largely expect that the return of XIV 2014 will end up somewhere along this line. Think about this chart for another minute. Essentially the trendline is telling us that XIV needs an average WRY of at least 0.5% to have a chance at being positive for the year. Factor in a few 25%+ XIV drawdowns and realistically it needs an average WRY of 1% to really provide some confidence in the trade. With VIX futures already quite compressed along the entire term structure, that 1% WRY will be difficult to maintain unless M1 is able to spend much more time in the 13s. This would imply a VIX down in the 11-12 range -- quite a tall order at the moment.
Outliers on the graph above are the result of either a) major differences of the yearly starting and ending values of M1 (i.e. in 2009 M1 went from 45 to 20), or b) large multi-day volatility spikes that cause major (50%+) drawdowns in XIV (e.g. 2006, 2007, 2011) which are difficult to recover from based on the dynamics of percentages (i.e. it takes a 100% gain to fully recover from a 50% loss). For reference, below is a chart showing the value of front month VIX futures over the past 9 years (note that while M1 is low compared to the recent 5 years, it is still higher than most of 2005 and 2006).

VXX Forecast Review
As I turn to look at our daily VXX Bias Forecasts history, below, you can see why we identify the area between -1 and +1 as a "neutral zone" (highlighted in yellow) which is subject to a certain amount of thrash. These are are times when VXX generally moves sideways and is more susceptible to spikes. After looking at this forecast history it's not much of a surprise to learn that neither VXX (-1.7%) nor XIV (-7.6%) have gone anywhere this year.

Summarizing the current situation for XIV (and VXX/UVXY):
The idea of reduced profit expectations for XIV is actually not new. Although XIV gained 107% in 2013, its gains have slowed to just +36% over the past 12 months. While we've talked about this several times last year (here and here and here), today we'll talk about why and take a look at the current outlook.
VIX Futures
The daily price movement of XIV/SVXY, VXX and UVXY/TVIX are determined by the price of the front two months of VIX futures. In the chart below you can see both front month (M1) and second month (M2) VIX futures over the past 12 months.
Current values of M1 (14.85) and M2 (15.75) are generally in the lower-middle portion of the range. We've seen these M1 & M2 price levels with a similar ~1 point spread before. In fact, M1 and M2 are essentially unchanged from 12 months ago and we've seen the same levels six other times during the past year (4/26, 7/29, 9/16, 10/30, 12/3, and 12/19). On all of these occasions we've seen M1 and M2 continue to fall, providing an average gain for XIV of 9% over the next 1-2 weeks. These gains tend to be short-lived as multi-day volatility spikes have resulted in 15%+ drawdowns in XIV for 5 of the 7 instances (exception were 10/30/13 and 12/3/13). This doesn't mean that the same thing will happen this time around, but it does provide some interesting data points.
We can see these moves reflected in the 1-year chart of XIV, below. While VIX futures are essentially unchanged over the past 12 months, monthly expiring futures and the roll yield continue to provide fuel for gains in XIV, which is +36% over the past 12 months (and VXX is -47%). There's no reason this dance can't continue at this "slower" rate as long as M1 and M2 remain range bound under 20, but periodic drawdowns are likely to continue resulting in choppy trading.
As a relevant side note, 3 month actual volatility in the S&P 500 (HV60) has risen about 1.3 points over the course of the past five months. This often serves as an approximate lower-bounds for VIX, as we can see in the HV-IV chart below (see green circles). This means VIX is less likely to soon push back down into the 11.9/12.3 range we saw late last year.
VXX Roll Yield
In addition to looking at the relative position of front month VIX futures, we need to also look at the headwind/tailwind for the securities that arises from the roll yield. The roll yield is proportional to the difference between the 1st and 2nd month VIX futures. Below I've charted VXX's weekly roll yield (WRY) over the past two years.
You can see how the roll yield for VXX has been much less negative so far this year, providing for less of a headwind for VXX and less of a tailwind for XIV/SVXY. In fact, so far this year the average VXX WRY has been just -0.7% (which is +0.7% for XIV). To put that number in context, below is a table of the average XIV weekly roll yield for each of the past 9 years.
XIV: Average Weekly Roll Yield vs. Annual Return
| Year | Avg WRY | Annual Return |
| 2005 | 1.6% | 101% |
| 2006 | 1.4% | 14% |
| 2007 | 0.6% | -35% |
| 2008 | -0.6% | -71% |
| 2009 | 0.9% | 118% |
| 2010 | 2.1% | 144% |
| 2011 | 0.5% | -46% |
| 2012 | 2.1% | 154% |
| 2013 | 1.6% | 107% |
| 2014 | 0.7% | -8% (YTD) |
The 2014 average WRY is more or less in the middle of the range between the low (-0.6%) and high (+2.1%). So why is this important? Because the return of VIX ETFs is largely dependent on the roll yield. as illustrated by a scatter plot for the above table.
You can largely expect that the return of XIV 2014 will end up somewhere along this line. Think about this chart for another minute. Essentially the trendline is telling us that XIV needs an average WRY of at least 0.5% to have a chance at being positive for the year. Factor in a few 25%+ XIV drawdowns and realistically it needs an average WRY of 1% to really provide some confidence in the trade. With VIX futures already quite compressed along the entire term structure, that 1% WRY will be difficult to maintain unless M1 is able to spend much more time in the 13s. This would imply a VIX down in the 11-12 range -- quite a tall order at the moment.
Outliers on the graph above are the result of either a) major differences of the yearly starting and ending values of M1 (i.e. in 2009 M1 went from 45 to 20), or b) large multi-day volatility spikes that cause major (50%+) drawdowns in XIV (e.g. 2006, 2007, 2011) which are difficult to recover from based on the dynamics of percentages (i.e. it takes a 100% gain to fully recover from a 50% loss). For reference, below is a chart showing the value of front month VIX futures over the past 9 years (note that while M1 is low compared to the recent 5 years, it is still higher than most of 2005 and 2006).
VXX Forecast Review
As I turn to look at our daily VXX Bias Forecasts history, below, you can see why we identify the area between -1 and +1 as a "neutral zone" (highlighted in yellow) which is subject to a certain amount of thrash. These are are times when VXX generally moves sideways and is more susceptible to spikes. After looking at this forecast history it's not much of a surprise to learn that neither VXX (-1.7%) nor XIV (-7.6%) have gone anywhere this year.
Summarizing the current situation for XIV (and VXX/UVXY):
- We've seen a narrow XIV weekly roll yield so far in 2014, but it has been increasing lately to the point where it is back above 1%. If XIV is going to continue to see gains the WRY needs to stay above this level.
- VIX futures are at the lower end of the range over the past few years. They've been at these levels and can continue lower, but their downside is more limited than the upside at this point, making for a pretty non-ideal time to aggressively short volatility.
- XIV has the potential to continue to rise as VIX futures roll forward each month. The next expiration date is April 16th.
-JW
. . . . . . . . . . . . . .
Stay up to date by having posts sent directly to your
RSS feed or
Email.
Tracking Russell 2000 and NASDAQ 100 Volatility Indices and Futures (RVX and VXN)
We recently expanded our tracking of volatility indices to include the Russell 2000 and NASDAQ 100. Each will be tracked along with the existing S&P 500 volatility (VIX) to provide a better view of these specific areas of the market.
Page contents:
RVX Futures Data
- Russell 2000 1-month implied volatility (RVX) and RVX futures
- Basic RVX futures metrics
- Russell 2000 historical volatility
- RVX futures closing prices over past six months
- Historical volatility vs implied volatility
VXN Futures Data
- NASDAQ 100 1-month implied volatility (VXN) and VXN futures
- Basic VXN futures metrics
- NASDAQ 100 historical volatility
- VXN futures closing prices over past six months
- Historical volatility vs implied volatility
Data on the RVX futures and VXN futures pages is currently available without the 1-week delay.
-JW
. . . . . . . . . . . . . .
Stay up to date by having posts sent directly to your
RSS feed or
Email.
Watching For The Return Of Volatility
Hello and welcome back! I hope everyone had a great Thanksgiving break.
Today I wanted to provide a brief look back on volatility over the past several weeks and provide my thoughts on what it means going forward. Ever since the debt ceiling deadlock concluded in October, VIX has remained in a fairly tight range between 12 and 14. Meanwhile, the S&P 500 has notched eight straight weeks of gains.
In this post I'll be covering:
Technical Review
Taking a look at the chart of implied volatility vs actual volatility (from the VIX Futures Data page), we can see that the current VIX range is roughly the same as what we saw in the July/August timeframe (orange highlight), which at the time, bounced along the floor set by HV60 (actual volatility over the last 60 trading days). Actual volatility in the S&P 500 has continued to decline since then and the HV60 floor is now two points lower, hitting 10.28 on Friday. This premium in VIX to HV60 tells us that options sellers are not yet convinced that the low volatility environment we are currently experiencing will continue into 2014.

The VIX futures term structure shows us a pretty consistent contango since mid October, with nearer months cheaper than the more distant months. Overall the movement has been mostly sideways with a slight decline across all months, while the front months futures have fallen more rapidly toward spot VIX.

Forecast Review
Looking at our forecast charts we can see that the Bias (left axis) has remained mostly negative for VXX and positive for ZIV. During this past 6 months VXX has declined from $80 to $45 (-43%), while VXX inverses (XIV and SVXY) have each gained 45%. Meanwhile, ZIV has increased 18%, moving from $30 to $35.80.


Taking a look at the VXX Spike Risk forecast we can really get a feel for how sleepy the volatility market has been lately with only a couple days above the 30% risk mark over the past 6 weeks.

Nov 15 VIX Reversal
On Nov 20th I posted in our Members' Forum about a possible reversal in the VIX daily chart that occurred on Nov 15th. While it is still possible to break lower, this remains something for VIX traders to watch in the coming weeks, especially as we press up against the 200 day moving average at 14.37 (red dashed line).

Elevated SKEW
The CBOE SKEW index has been elevated near 130 for a few weeks now (weekly chart below) and is at its highest levels since March 2012. This value tells us that the options market views a higher probability of returns that are two or more standard deviations below the mean over the next 30 days, which represents a 15%+ decline in the S&P 500. Given the recent run-up in stocks an expectation of a pullback isn't too surprising, but is something to be prepared for nonetheless.

Trading Plan (Member Access Only)
Please login to the Members' Forum to finish reading this article. If you're not yet a member you can join via the Subscribe page.
Today I wanted to provide a brief look back on volatility over the past several weeks and provide my thoughts on what it means going forward. Ever since the debt ceiling deadlock concluded in October, VIX has remained in a fairly tight range between 12 and 14. Meanwhile, the S&P 500 has notched eight straight weeks of gains.
In this post I'll be covering:
- Technical Review
- Forecast Review
- Nov 15 VIX Reversal
- Elevated SKEW
- Trading Plan (Member Access Only)
Taking a look at the chart of implied volatility vs actual volatility (from the VIX Futures Data page), we can see that the current VIX range is roughly the same as what we saw in the July/August timeframe (orange highlight), which at the time, bounced along the floor set by HV60 (actual volatility over the last 60 trading days). Actual volatility in the S&P 500 has continued to decline since then and the HV60 floor is now two points lower, hitting 10.28 on Friday. This premium in VIX to HV60 tells us that options sellers are not yet convinced that the low volatility environment we are currently experiencing will continue into 2014.
The VIX futures term structure shows us a pretty consistent contango since mid October, with nearer months cheaper than the more distant months. Overall the movement has been mostly sideways with a slight decline across all months, while the front months futures have fallen more rapidly toward spot VIX.
Forecast Review
Looking at our forecast charts we can see that the Bias (left axis) has remained mostly negative for VXX and positive for ZIV. During this past 6 months VXX has declined from $80 to $45 (-43%), while VXX inverses (XIV and SVXY) have each gained 45%. Meanwhile, ZIV has increased 18%, moving from $30 to $35.80.
Taking a look at the VXX Spike Risk forecast we can really get a feel for how sleepy the volatility market has been lately with only a couple days above the 30% risk mark over the past 6 weeks.
Nov 15 VIX Reversal
On Nov 20th I posted in our Members' Forum about a possible reversal in the VIX daily chart that occurred on Nov 15th. While it is still possible to break lower, this remains something for VIX traders to watch in the coming weeks, especially as we press up against the 200 day moving average at 14.37 (red dashed line).
The CBOE SKEW index has been elevated near 130 for a few weeks now (weekly chart below) and is at its highest levels since March 2012. This value tells us that the options market views a higher probability of returns that are two or more standard deviations below the mean over the next 30 days, which represents a 15%+ decline in the S&P 500. Given the recent run-up in stocks an expectation of a pullback isn't too surprising, but is something to be prepared for nonetheless.
Trading Plan (Member Access Only)
Please login to the Members' Forum to finish reading this article. If you're not yet a member you can join via the Subscribe page.
-JW
. . . . . . . . . . . . . .
Stay up to date by having posts sent directly to your
RSS feed or
Email.
Volatility Trading Outlook With The S&P 500 At All Time Highs
With the debt ceiling drama behind us the S&P has responded by making new all-time highs, while the VIX has fallen back to levels from Sept 20 and are VIX futures are back in a moderate contango. From the VIX Futures Data page:

Since Oct 18, VIX and VIX futures have been essentially frozen with intraday ranges of only a couple points for VIX and a range of closing values of just 0.38 points. The fact that VIX futures across all months are not declining, but flat (and ever so slightly up in months 3-7), is indication that all may not be well -- especially as the S&P is hitting all time highs. Usually when we see the VIX term structure hold steady like this investors are starting to pick up on some sort of risk on the horizon (see May 10th - 21st), however, no risk seems to be readily apparent at the moment (although I can name several that are on my mind). Maybe this is just a period of consolidation after a swift move down, but it doesn't quite sit right with me.
It is a five week roll period this month, with 17 trading days still left until November futures expire on Nov 20. Assuming we manage to avoid unforeseen drama during this time we should expect Nov futures to converge towards VIX (Nov currently at a 11% premium to VIX), and VIX to fall along with HV20 towards HV60. This will cause VXX to drift lower and SVXY higher, however the entire futures curve is once again rather compressed with limited room to the downside and larger risk to the upside. I see a ceiling for XIV over the next few weeks in the $32-33 area (~$125 for SVXY). For ZIV, $36 looks to be the limit.

With people increasingly predicting new highs and getting greedy I start to get concerned and like to raise cash. No one really knows if we'll go on like this for months or if the rally ends tomorrow, but all good things come to end so it's always good to take profits along the way and raise stops to help manage risk.

Since Oct 18, VIX and VIX futures have been essentially frozen with intraday ranges of only a couple points for VIX and a range of closing values of just 0.38 points. The fact that VIX futures across all months are not declining, but flat (and ever so slightly up in months 3-7), is indication that all may not be well -- especially as the S&P is hitting all time highs. Usually when we see the VIX term structure hold steady like this investors are starting to pick up on some sort of risk on the horizon (see May 10th - 21st), however, no risk seems to be readily apparent at the moment (although I can name several that are on my mind). Maybe this is just a period of consolidation after a swift move down, but it doesn't quite sit right with me.
It is a five week roll period this month, with 17 trading days still left until November futures expire on Nov 20. Assuming we manage to avoid unforeseen drama during this time we should expect Nov futures to converge towards VIX (Nov currently at a 11% premium to VIX), and VIX to fall along with HV20 towards HV60. This will cause VXX to drift lower and SVXY higher, however the entire futures curve is once again rather compressed with limited room to the downside and larger risk to the upside. I see a ceiling for XIV over the next few weeks in the $32-33 area (~$125 for SVXY). For ZIV, $36 looks to be the limit.

With people increasingly predicting new highs and getting greedy I start to get concerned and like to raise cash. No one really knows if we'll go on like this for months or if the rally ends tomorrow, but all good things come to end so it's always good to take profits along the way and raise stops to help manage risk.
-JW
. . . . . . . . . . . . . .
Stay up to date by having posts sent directly to your
RSS feed or
Email.
Is VIX Expensive Yet?
Today the VIX closed at 16.6 while actual market volatility over the past month (HV20) closed at 8.71, resulting of a volatility risk premium of 90.6% (calculated as (VIX/HV20) -1 ) -- (See VIX Futures Data page).
Traders will often look at what is know as the "volatility risk premium" to determine if VIX is cheap or expensive. The volatility risk premium is essentially a comparison of the VIX (expected volatility over the next 30 days (annualized)) and HV20 (actual market volatility over the past 20 trading days, i.e. the trailing 30 days).
The logic is that the market going forward should typically experience a similar amount of volatility that the market has experienced in the past. However, we typically see a VIX greater than HV20 since sellers of options need to be paid a premium for a certain amount of risk that traders expect in the market. A greater amount of expected volatility will cause the premium to increase.
A simple interpretation of this measure is that VIX is considered "expensive" when it is much greater than HV20, and "cheap" when it is much less than HV20.
While this is a relative measurement, today's volatility risk premium of 90.6% looks pretty expensive. But don't expect to VIX to fall just yet.
First of all, the value is a ratio. As actual market volatility increases (during a large rally or large sell off) the ratio will get smaller (given a steady VIX).
Also, 90.6% isn't too crazy just yet. Below are some points over the past 10 years where the market saw other peaks in the volatility risk premium.
Lastly, don't forget that if you trade VIX ETPs, they all track to VIX futures and what matters most is the term structure.
Happy Trading!
Traders will often look at what is know as the "volatility risk premium" to determine if VIX is cheap or expensive. The volatility risk premium is essentially a comparison of the VIX (expected volatility over the next 30 days (annualized)) and HV20 (actual market volatility over the past 20 trading days, i.e. the trailing 30 days).
The logic is that the market going forward should typically experience a similar amount of volatility that the market has experienced in the past. However, we typically see a VIX greater than HV20 since sellers of options need to be paid a premium for a certain amount of risk that traders expect in the market. A greater amount of expected volatility will cause the premium to increase.
A simple interpretation of this measure is that VIX is considered "expensive" when it is much greater than HV20, and "cheap" when it is much less than HV20.
While this is a relative measurement, today's volatility risk premium of 90.6% looks pretty expensive. But don't expect to VIX to fall just yet.
First of all, the value is a ratio. As actual market volatility increases (during a large rally or large sell off) the ratio will get smaller (given a steady VIX).
Also, 90.6% isn't too crazy just yet. Below are some points over the past 10 years where the market saw other peaks in the volatility risk premium.
- 2/15/12 151.5% (VIX 21.14; HV20 8.40)
- 3/5/12: 153.6% (VIX 18.05; HV20 7.12)
- 5/18/12: 113.1% (VIX 25.10; HV20 11.78)
- 9/5/12: 195.2% (VIX 17.74; HV20 6.01)
- 12/28/12: 128.8% (VIX 22.72; HV20 9.93)
- 1/31/13: 157.8% (VIX 14.28; HV20 5.54)
- 4/1/13: 74.6% (VIX 13.58; HV20 7.78)
- 6/3/13: 62.9% (VIX 16.28; HV20 9.99)
- 8/9/13: 103.5% (VIX 13.41 HV20 6.59)
The highest this ratio got before the Aug 2011 selloff was 64.1%, which occurred on 8/1/11 (VIX 23.66; HV20 14.42). After that HV20 then pretty quickly rose to a lofty 50.66 (8/29/11) and the ratio hit -36.3%.
More fun facts:
- The highest HV20 over the past 10 years was 85.19 (on 11/5/2008).
- The highest VIX to HV20 ratio over the past 10 years was 289% on 12/31/10 (VIX 17.75; HV20 4.57)
Lastly, don't forget that if you trade VIX ETPs, they all track to VIX futures and what matters most is the term structure.
Happy Trading!
-JW
. . . . . . . . . . . . . .
Stay up to date by having posts sent directly to your
RSS feed or
Email.
Trading VIX Around the Upcoming Debt Ceiling Debate
With another debt ceiling debate looming just around the corner, many volatility traders ask "How do I play this event?"
Well to answer that question I like to first figure out where VIX is trading. Currently:
These values tell us that a VIX of 14.42 is actually high given the amount of volatility that the market is actually experiencing -- VIX is at a 25% premium to HV20 and a 50% premium to HV60. The market is already expecting a greater amount of volatility in the next month compared to what we have experienced in the past 3 months.
The recent rise in VIX to 17 in late August was for the most part attributed to the events in Syria. Once was a diplomatic solution was "found" VIX began to retreat to normal levels. As you can see by the green circles in the graph below, VIX tends to fall toward the "floor" set by HV60. With HV60 currently below 10 and VIX at 14.39 there is still a long ways to fall (33%). However, just because the floor is down below 10 doesn't mean that it'll necessarily make it down there. HV20 is on the rise, moving from 6.49 in early August to above 11 today, an indication that the market as a whole is growing more volatile.

An interesting point in the chart above is 8/30/13 (see red rectangle) when the value of front month VIX futures (M1) was 17.5 and HV20 was 9.58, an 83% premium. It is rare for front month VIX to be above 17 while HV20 is below 10. In fact, in the past nine years this has only happened a handful of times (7/2004, 12/2009, 3/2010, 11-12/2010, 1/2011, 4/2011, 2/2012, 8/2012, 12/2012). In most instances M1 and HV20 converge towards each other over the next 3-6 weeks then rise rapidly together as VIX and actual volatility spike. We'll soon find out if the 8/30/2013 instance follows a similar pattern.
But given that VIX is trading at a premium to actual volatility and VIX futures are in contango, the expectation is that VIX and VIX futures will continue to fall. That means the "correct" long-term play as of now, due to the structure of VIX ETPs, is to continue to short volatility both for near-term VIX futures (long SVXY/XIV or short VXX/TVIX/UVXY) and medium-term VIX futures (ZIV), although I believe that smaller positions are warranted given the compression in the VIX futures curve.
Now that we've taken a look at the technical side, let's get back to the question about the debt ceiling.
We've been through several rounds of debt ceiling political theater weighing on the stock market. After a few rounds of debt ceiling and sequester deadlines in the past 2 years the market seems to be getting used to the sequence of events, complete with a last minute deal to once again kick the can into the future.
One idea of how to play the Sept/Oct 2013 episode is to wait for a VIX spike that occurs in the final hours of negotiation just before the deadline and short volatility. History gives us some positive data that this could be a good play. However, this strategy depends on several points:
1) Will market participants fret enough to cause a rise in VIX in advance of the event?
2) Will a deal get done?
3) Will a market-positive deal get done?
I prefer to take the information one day at a time to see how this episode plays out, closely watching for any significant changes to the VIX futures term structure and ensuring I have appropriate stops in place. The biases remain positive for SVXY, XIV and ZIV and negative for VXX, TVIX, and UVXY so I like to use those to my advantage while they exist.
Also remember that some periods of trading are easier than others. A directional move is easier to trade and more profitable than a choppy market, and you have to expect that the market over the coming weeks will be choppy and event-driven. There is a good case to be made to avoid this period altogether and wait for the "easy" money to be made once a new direction has been established.
Well to answer that question I like to first figure out where VIX is trading. Currently:
- VIX sits at 14.42 (currently +9.9% on the day)
- Actual volatility of the S&P 500 over the past month (HV20) is at 11.50,
- Actual volatility over the past 3 months (HV60) is 9.58.
These values tell us that a VIX of 14.42 is actually high given the amount of volatility that the market is actually experiencing -- VIX is at a 25% premium to HV20 and a 50% premium to HV60. The market is already expecting a greater amount of volatility in the next month compared to what we have experienced in the past 3 months.
The recent rise in VIX to 17 in late August was for the most part attributed to the events in Syria. Once was a diplomatic solution was "found" VIX began to retreat to normal levels. As you can see by the green circles in the graph below, VIX tends to fall toward the "floor" set by HV60. With HV60 currently below 10 and VIX at 14.39 there is still a long ways to fall (33%). However, just because the floor is down below 10 doesn't mean that it'll necessarily make it down there. HV20 is on the rise, moving from 6.49 in early August to above 11 today, an indication that the market as a whole is growing more volatile.
An interesting point in the chart above is 8/30/13 (see red rectangle) when the value of front month VIX futures (M1) was 17.5 and HV20 was 9.58, an 83% premium. It is rare for front month VIX to be above 17 while HV20 is below 10. In fact, in the past nine years this has only happened a handful of times (7/2004, 12/2009, 3/2010, 11-12/2010, 1/2011, 4/2011, 2/2012, 8/2012, 12/2012). In most instances M1 and HV20 converge towards each other over the next 3-6 weeks then rise rapidly together as VIX and actual volatility spike. We'll soon find out if the 8/30/2013 instance follows a similar pattern.
But given that VIX is trading at a premium to actual volatility and VIX futures are in contango, the expectation is that VIX and VIX futures will continue to fall. That means the "correct" long-term play as of now, due to the structure of VIX ETPs, is to continue to short volatility both for near-term VIX futures (long SVXY/XIV or short VXX/TVIX/UVXY) and medium-term VIX futures (ZIV), although I believe that smaller positions are warranted given the compression in the VIX futures curve.
Now that we've taken a look at the technical side, let's get back to the question about the debt ceiling.
We've been through several rounds of debt ceiling political theater weighing on the stock market. After a few rounds of debt ceiling and sequester deadlines in the past 2 years the market seems to be getting used to the sequence of events, complete with a last minute deal to once again kick the can into the future.
One idea of how to play the Sept/Oct 2013 episode is to wait for a VIX spike that occurs in the final hours of negotiation just before the deadline and short volatility. History gives us some positive data that this could be a good play. However, this strategy depends on several points:
1) Will market participants fret enough to cause a rise in VIX in advance of the event?
- In the July 2011 episode VIX ranged between 15 and 21. In Nov/Dec 2012 VIX ranged between 15 and 19.6. After hitting 12.52 last Friday, VIX is now at 14.32 with just one week left for congress to pass a "Continued Resolution" to continue spending after Sept 30th, and several weeks until all extraordinary measures to continue spending have been exhausted by the Treasury. Not only is the market not worried about this, but there's not even the infamous "countdown clocks" on the major media stations. I think you have to assume it will be political grandstanding business as usual and implied volatility will rise over the next several weeks, but it is not clear if this will happen as a gradual build up to the event, or more quickly just as the event is about to occur. Being long VXX over the next few weeks could be difficult given the "headwind" it faces due to the contango term structure.
2) Will a deal get done?
- I think the answer is yes and I believe the market believes the answer is yes. Whenever this happens, the immediate reaction will most likely be positive and make for a very good short volatility play (assuming there is a build up in VIX leading up to it).
3) Will a market-positive deal get done?
- Given the ratings downgrade and sell off after the July 2011 episode, this question should be of concern to investors as well. While a deal is likely to get done, investors will be looking at the "cost" of the deal. The details of the deal, as well as the manner in which it is achieved, are just as important as the deal getting done in the first place. This will remain an unknown until it happens but is something to keep an eye on after the immediate reaction.
I prefer to take the information one day at a time to see how this episode plays out, closely watching for any significant changes to the VIX futures term structure and ensuring I have appropriate stops in place. The biases remain positive for SVXY, XIV and ZIV and negative for VXX, TVIX, and UVXY so I like to use those to my advantage while they exist.
Also remember that some periods of trading are easier than others. A directional move is easier to trade and more profitable than a choppy market, and you have to expect that the market over the coming weeks will be choppy and event-driven. There is a good case to be made to avoid this period altogether and wait for the "easy" money to be made once a new direction has been established.
-JW
. . . . . . . . . . . . . .
Stay up to date by having posts sent directly to your
RSS feed or
Email.
Looking Ahead At VIX & VIX Futures Near All-Time Market Highs
The stock market has been rallying in full force over the past month with the S&P 500 up 7.2% since it put in its low on 6/24.
VIX has fallen 34.5% since that date with VIX futures following suit across the board (see chart below), driving VIX-related ETPs accordingly:
XIV: +40.7%
ZIV: +16.6%
VXX: -30.0%
UVXY: -52%

Our Daily Forecasts have performed well over this time, with the VXX bias shifting from positive back to negative on the evening of 6/21...

...and the VXX Spike risk dropping back below the danger zone (60%) on the evening of 6/25 and staying there ever since.

Actual historical volatility of the S&P 500 has started coming into play to hold the VIX up a bit. HV60, the actual volatility over the past 3 months (60 trading days), is serving as a floor to the VIX, as can be seen in the chart below.

For trading of VIX ETPs over the coming weeks what's important to note is...
Continue reading this post on the Members' Forum
If you are not yet a member you can Subscribe for access to Trading Volatility+.
VIX has fallen 34.5% since that date with VIX futures following suit across the board (see chart below), driving VIX-related ETPs accordingly:
Our Daily Forecasts have performed well over this time, with the VXX bias shifting from positive back to negative on the evening of 6/21...
...and the VXX Spike risk dropping back below the danger zone (60%) on the evening of 6/25 and staying there ever since.
Actual historical volatility of the S&P 500 has started coming into play to hold the VIX up a bit. HV60, the actual volatility over the past 3 months (60 trading days), is serving as a floor to the VIX, as can be seen in the chart below.
For trading of VIX ETPs over the coming weeks what's important to note is...
Continue reading this post on the Members' Forum
If you are not yet a member you can Subscribe for access to Trading Volatility+.
-JW
. . . . . . . . . . . . . .
Stay up to date by having posts sent directly to your
RSS feed or
Email.
VIX Nears A Floor After A Week Of Heavy VIX Selling
VIX took a holiday as well this week falling 11.9% from last Friday's close. The VIX Futures term structure contango steepened as all months along the curve fell in proportion to VIX. Here's the week over week change in term structure:

From our daily forecasts we can see that after a month of elevated spike risk, the VXX Spike Risk forecast fell below the 5.0 "danger zone" on the evening of June 26th and remained there this week, with VXX losing 12% since that time (and XIV +13.3%).

Spot VIX is starting to press down towards the VIX "floor" set by actual market volatility over the past 3 months (HV60), with VIX now just 5% higher than HV60. We could still see VIX press down into the 13s, but I don't expect it to head much lower (see green circles below).

UPDATED 7/8: Corrected week-over-week term structure chart and VIX % change

From our daily forecasts we can see that after a month of elevated spike risk, the VXX Spike Risk forecast fell below the 5.0 "danger zone" on the evening of June 26th and remained there this week, with VXX losing 12% since that time (and XIV +13.3%).

Spot VIX is starting to press down towards the VIX "floor" set by actual market volatility over the past 3 months (HV60), with VIX now just 5% higher than HV60. We could still see VIX press down into the 13s, but I don't expect it to head much lower (see green circles below).

UPDATED 7/8: Corrected week-over-week term structure chart and VIX % change
-JW
. . . . . . . . . . . . . .
Stay up to date by having posts sent directly to your
RSS feed or
Email.
When XIV Loses Its Edge: Getting Into Defensive Mode
Actual market volatility has clearly picked up over the past month as the broad market tests both upper and lower ranges to figure out the next major direction.

As I discussed in our members' forum post on 6/14, I expect choppy conditions and urge caution for XIV longs over the next few months. During this time there will be streaks of days where VXX will gain and streaks when XIV will gain, but over the course of weeks I tend to think the wide price swings will prevent either of these from really going anywhere.


I think there are still opportunities to make money by trading XIV and VXX in these swings but it requires a more active trading strategy with shorter hold times (a few days), and use of smaller positions since trends will be unpredictable. The VXX bias remains small meaning that the "edge" in trading these products is mostly gone for now, so trading these swings also requires a bit of luck as it ultimately becomes a guessing game for the next direction -- a strategy that is not usually profitable.
I'm inclined to keep a good amount of my portfolio in cash and put some money in ZIV where the price swings are smaller, as long as the bias forecast is positive and I can still get a decent roll yield.
Picking up some VXX here is very tempting as I think there is a good chance it heads higher over the next few months, but again I think in the short term it will see some wild swings so I prefer to wait until there is a positive bias behind it even if it means missing out on some of the gains.

As I discussed in our members' forum post on 6/14, I expect choppy conditions and urge caution for XIV longs over the next few months. During this time there will be streaks of days where VXX will gain and streaks when XIV will gain, but over the course of weeks I tend to think the wide price swings will prevent either of these from really going anywhere.
Overall the volatility futures market is not sending very positive signals, as we can see from the data on our VIX Futures Data page.
The premium of front month VIX futures to VIX has been decreasing (a concept I outline here):

The slope of the term structure is flattening (which I define as important here):

I think there are still opportunities to make money by trading XIV and VXX in these swings but it requires a more active trading strategy with shorter hold times (a few days), and use of smaller positions since trends will be unpredictable. The VXX bias remains small meaning that the "edge" in trading these products is mostly gone for now, so trading these swings also requires a bit of luck as it ultimately becomes a guessing game for the next direction -- a strategy that is not usually profitable.
I'm inclined to keep a good amount of my portfolio in cash and put some money in ZIV where the price swings are smaller, as long as the bias forecast is positive and I can still get a decent roll yield.
Picking up some VXX here is very tempting as I think there is a good chance it heads higher over the next few months, but again I think in the short term it will see some wild swings so I prefer to wait until there is a positive bias behind it even if it means missing out on some of the gains.
-JW
. . . . . . . . . . . . . .
Stay up to date by having posts sent directly to your
RSS feed or
Email.
Notice: Update To Historical Volatility Calculations
Changes have just been made throughout the site to the number of days that are used to calculate historical volatility.
- The 1-month lookback period now uses data from the 20 most recent trading days (HV20) instead of 21
- The 3-month lookback period now uses data from the 60 most recent trading days (HV60) instead of 63
The changes bring these metrics into line with what most traders are familiar with.
- The 1-month lookback period now uses data from the 20 most recent trading days (HV20) instead of 21
- The 3-month lookback period now uses data from the 60 most recent trading days (HV60) instead of 63
The changes bring these metrics into line with what most traders are familiar with.
-JW
. . . . . . . . . . . . . .
Stay up to date by having posts sent directly to your
RSS feed or
Email.
VIX Futures Flash Warning Signs
Some negative developments in the VIX futures term structure occurred today with a flattening of the term structure (see full current term structure data here):
- Spread between M1 and M2 narrowed to -0.75
- Spread between M4 and M7 narrowed to -1.15
- Spread from M1 to M7 narrowed to just -3.15 points
The roll yields for XIV and ZIV fell to 1.1% and 1.5%, respectively.
To put the M1-M7 spread in context here is a view of the slope of the VIX futures (left axis) along with the price on XIV (right axis). A slope reading below 0.2 has typically been market negative in the very short term over the past few years (today's closing was 0.19).

The rise in VIX to 14.49 (+7.2%) brings it to within 5% of front month futures and increases the risk of a larger VXX spike in the short term. The volatility risk premium remains negative, with actual volatility over the past month (HV21) at 14.77.
The VXX forecast VXX spike gauge reflects these changes with a reading of 5.8. When the reading on here is above ~5.5 you can generally expect some choppiness in the price of XIV & VXX as a best case, and worst case of some large VXX moves upward.

Because of these current conditions and a multitude of warning signals I'm still not interested in a XIV long position. As I've suggested in the past week here, here, and here it makes sense to look into some cheap VXX calls as a hedge if I were long XIV/SVXY or be out altogether.
- Spread between M1 and M2 narrowed to -0.75
- Spread between M4 and M7 narrowed to -1.15
- Spread from M1 to M7 narrowed to just -3.15 points
The roll yields for XIV and ZIV fell to 1.1% and 1.5%, respectively.
To put the M1-M7 spread in context here is a view of the slope of the VIX futures (left axis) along with the price on XIV (right axis). A slope reading below 0.2 has typically been market negative in the very short term over the past few years (today's closing was 0.19).

The rise in VIX to 14.49 (+7.2%) brings it to within 5% of front month futures and increases the risk of a larger VXX spike in the short term. The volatility risk premium remains negative, with actual volatility over the past month (HV21) at 14.77.
The VXX forecast VXX spike gauge reflects these changes with a reading of 5.8. When the reading on here is above ~5.5 you can generally expect some choppiness in the price of XIV & VXX as a best case, and worst case of some large VXX moves upward.
Because of these current conditions and a multitude of warning signals I'm still not interested in a XIV long position. As I've suggested in the past week here, here, and here it makes sense to look into some cheap VXX calls as a hedge if I were long XIV/SVXY or be out altogether.
-JW
. . . . . . . . . . . . . .
Stay up to date by having posts sent directly to your
RSS feed or
Email.
Daily Wrap, April VIX Expiration, and VXX Forecast for 4/17
The term structure reverted back to a (slight) contango today with April and May separated by 0.8 points, as seen in the term structure from the VIX Futures Data page.

Since VIX futures roll tomorrow morning I care more about the May and June futures, which are separated by 0.95 points. This will set up to be a good chance to buy XIV if the market can find any foothold tomorrow. One problem with the trade, however, is that VIX is not really overpriced here. Historical (actual) volatility over the past month is now 13.47, with VIX just 3.7% higher, as shown in the HV vs IV chart:

Sellers of options want to collect a premium that is reflective of historical conditions and future risks and it remains to be seen if traders think that the action in the past couple days was just a fluke. If we can get some calm days in the market, both VIX and HV21 will drift lower, possibly as low as actual volatility over the past 3 months (HV63) which is currently around 11.0 -- ~20% lower than where VIX is currently.
The other risk to the trade is that May futures aren't really overpriced either. At 14.75, May VIX futures are just 5.6% above spot VIX, meaning there is not much buffer to absorb a spike in VIX, making a sharp drop in XIV very possible if the market sees more selling.
In addition to the roll yield of about 1.4% per week on XIV, another positive data point for the trade is that the market is down 1.2% over the past three days while VIX is up 14%. This suggests that the move in VIX may have been overdone, especially if you think the market has already priced in risk from what has happened over the past few days..
Taking a look at the the VXX Forecast for tomorrow (preview), we can see that the roll yield and risk of a VXX spike reflect the numbers discussed above.


Since VIX futures roll tomorrow morning I care more about the May and June futures, which are separated by 0.95 points. This will set up to be a good chance to buy XIV if the market can find any foothold tomorrow. One problem with the trade, however, is that VIX is not really overpriced here. Historical (actual) volatility over the past month is now 13.47, with VIX just 3.7% higher, as shown in the HV vs IV chart:

Sellers of options want to collect a premium that is reflective of historical conditions and future risks and it remains to be seen if traders think that the action in the past couple days was just a fluke. If we can get some calm days in the market, both VIX and HV21 will drift lower, possibly as low as actual volatility over the past 3 months (HV63) which is currently around 11.0 -- ~20% lower than where VIX is currently.
The other risk to the trade is that May futures aren't really overpriced either. At 14.75, May VIX futures are just 5.6% above spot VIX, meaning there is not much buffer to absorb a spike in VIX, making a sharp drop in XIV very possible if the market sees more selling.
In addition to the roll yield of about 1.4% per week on XIV, another positive data point for the trade is that the market is down 1.2% over the past three days while VIX is up 14%. This suggests that the move in VIX may have been overdone, especially if you think the market has already priced in risk from what has happened over the past few days..
Taking a look at the the VXX Forecast for tomorrow (preview), we can see that the roll yield and risk of a VXX spike reflect the numbers discussed above.

-JW
. . . . . . . . . . . . . .
Stay up to date by having posts sent directly to your
RSS feed or
Email.
Actual Volatility and Forward Implied Volatility Continue To Diverge
Actual historical volatility for the S&P 500 over the past 3 months (HV63) fell to 9.24 today, putting current 30-day forward volatility (VIX) at a 50% premium. From the VIX Futures Data page:


Some other interesting action today can be observed by using the intraday SPY arbitrage model, which seemed to be all over the map.


This is getting to be a pretty large gap and it looks like it could be a good time for new long positions in XIV in the next day or two. However the risk of a position in XIV right now is that the premium between VIX and front month futures (the yellow and blue lines above) is only 2%. This means that if we do see a VIX spike there is very little "buffer" in M1 to absorb the spike so it will be more likely to see gains as well, especially if VIX stays above M1 for a few days.
We can see this risk reflected in the VXX Daily Forecast gauges. A short VXX (or long XIV) position is still in favor (just barely), but the risk of a spike has been increasing over the past several days. In fact, if you look at the daily chart of VIX you'll see that it's been on a choppy rise over the past 2 weeks -- a pattern that sometimes leads to a large VIX spike. I still think that a smaller position or no position is justified until we see some real relief in the VIX..

Some other interesting action today can be observed by using the intraday SPY arbitrage model, which seemed to be all over the map.

Short term futures were up over 2% (as seen in the decline of XIV), pricing in a downward move in the SPY. The term structure for the first two months flattened to under 1 point until about mid-day when XIV decided to reverse to catch up to SPY and close up 1.5%. VIX futures closed lower and with a wider contango spread (-1.3).
Treasury yields decoupled from SPY, falling all day and closing substantially lower (see TBF).
High Yield Credit (HYG) sold off pretty hard toward the end of the day and finished negative.
So a bit of disagreement between assets and reason for continued caution.
-JW
. . . . . . . . . . . . . .
Stay up to date by having posts sent directly to your
RSS feed or
Email.
Weekly Wrap and the Week Ahead
A slow and steady week in VIX futures brought down all points along the curve with some additional emphasis on the front two months. Overall the term structure remains somewhat compressed, with just 4.7 points separating 1st and 7th month.

There was a slight divergence in correlation between XIV and SPY today as we closed at new SPX highs - a signal for some caution in both XIV and SPX longs. From the intraday SPY arbitrage model:

Treasuries and high yield corporate bonds diverged from SPY during the week as well, widening the gap on the daily SPY arbitrage model, with SPY trading at a $5.00 premium to the model:

And yet there's no reason VIX can't head lower given that actual volatility over the past 3 months (HV63) is just 10.8.

-JW
. . . . . . . . . . . . . .
Stay up to date by having posts sent directly to your
RSS feed or
Email.
The Week Ahead In VIX Futures
Very little changed on the week for VIX futures, with most months only gaining 1-2%. Spot VIX however came off its low of 11.05 last week and gained 22%. Week-over-week term structure (does not include March VIX futures which expired this week):

The term structure may look normal but if you consider the steepness of the curve you'll see it flattened a bit this week, down to just 4.5 points separating 1st and 7th month (from 5.8 points last week). Month 1 to month 2 flattened as well, down to 1.25 points from 2.1 last week. This results in a relatively small positive roll yield in XIV, which by itself, isn't likely to get you very far.
Forward implied volatility remains reasonably priced relative to 1- and 3-month historical volatility, with a ~25% premium. From the VIX Futures Data page:

Of course most of next week's action will likely be influenced by the outcome of the Cyprus bailout negotiations. If they can reach a favorable outcome, VIX is likely to fall back toward 1- and 3- month historical volatility, currently near 11. There are many opinions on what will happen but I found this piece from the former Vice Chairman of Moody's to be particularly interesting.
Lastly, a chart of the intraday SPY arbitrage model from today. Model components broke from tracking the S&P's +0.8% move today, with treasuries and volatility remaining flat and high yield credit being sold.

The term structure may look normal but if you consider the steepness of the curve you'll see it flattened a bit this week, down to just 4.5 points separating 1st and 7th month (from 5.8 points last week). Month 1 to month 2 flattened as well, down to 1.25 points from 2.1 last week. This results in a relatively small positive roll yield in XIV, which by itself, isn't likely to get you very far.
Forward implied volatility remains reasonably priced relative to 1- and 3-month historical volatility, with a ~25% premium. From the VIX Futures Data page:
Of course most of next week's action will likely be influenced by the outcome of the Cyprus bailout negotiations. If they can reach a favorable outcome, VIX is likely to fall back toward 1- and 3- month historical volatility, currently near 11. There are many opinions on what will happen but I found this piece from the former Vice Chairman of Moody's to be particularly interesting.
Lastly, a chart of the intraday SPY arbitrage model from today. Model components broke from tracking the S&P's +0.8% move today, with treasuries and volatility remaining flat and high yield credit being sold.
-JW
. . . . . . . . . . . . . .
Stay up to date by having posts sent directly to your
RSS feed or
Email.
Looking at the New VIX Futures Months After March Expiration
Today is the last day of trading for March 2013 VIX futures. As discussed would happen in my week ahead post, March futures closed within about 3% of VIX.
Closing term structure:

Looking forward to tomorrow April currently sits at 15.4 and May at 16.25 resulting in a smaller contango spread of -0.85, which applies to XIV, VXX, and UVXY. With VIX at 14.39, April VIX futures are just 7% higher.
For those looking at trading ZIV, the contango spread between month 4 and month 7 will start narrower at -1.5 tomorrow.
Implied volatility has popped up a bit off of realized volatility, but with a volatility risk premium of 26% VIX pretty well priced once more. Here is the current chart from the VIX Futures Data page:

There was not much room to play in the intraday SPY arbitrage model today as the model stuck closely to the SPY.

And in case you missed it I posted about a new tool today to measure Twitter sentiment on VXX which was positive earlier in the day but is unsurprisingly heading toward 50/50 as VXX ended the day flat.
-JW
. . . . . . . . . . . . . .
Stay up to date by having posts sent directly to your
RSS feed or
Email.
VIX Pushing Lower Bounds Set By Historical Volatility
Protection through the purchase of options became even cheaper today as 30-day forward implied volatility (VIX) hit 11.46 -- just 2% above actual realized volatility for the past month (HV21) of 11.24. HV21 is now also roughly equal to the actual volatility over the past three months (HV63), which as I discussed previously, can be used as a reasonable lower bounds for VIX.
Below is a view of today's HV vs IV chart from the VIX futures data page to illustrate where VIX is in relation to historical volatility (three month view):

Next is a view of VIX vs HV63 from June 2004-Present which shows how HV63 can be used as a rough approximation for the lower bounds of VIX in the immediate future under most circumstances:

And while it is possible to say that VIX is running out of room to fall given current levels of historical volatility, VIX futures are another story entirely. As the VIX futures expiration date approaches (March 20th), March VIX futures and spot VIX are likely to converge to within a couple percent of each other (discussed here). At 9% above VIX there is quite a ways for March VIX futures, and consequently VXX, to fall -- assuming spot VIX remains near its current levels.
Looking at April VIX futures, which will become front month futures used in the calculation of VXX and XIV after March expiration, you can see that they now trade at 14.7, more than 27% higher than spot VIX right now. This will provide a new catalyst for a lower VXX and higher XIV as long as VIX remains flat.
Below is a view of today's HV vs IV chart from the VIX futures data page to illustrate where VIX is in relation to historical volatility (three month view):

Next is a view of VIX vs HV63 from June 2004-Present which shows how HV63 can be used as a rough approximation for the lower bounds of VIX in the immediate future under most circumstances:

And while it is possible to say that VIX is running out of room to fall given current levels of historical volatility, VIX futures are another story entirely. As the VIX futures expiration date approaches (March 20th), March VIX futures and spot VIX are likely to converge to within a couple percent of each other (discussed here). At 9% above VIX there is quite a ways for March VIX futures, and consequently VXX, to fall -- assuming spot VIX remains near its current levels.
Looking at April VIX futures, which will become front month futures used in the calculation of VXX and XIV after March expiration, you can see that they now trade at 14.7, more than 27% higher than spot VIX right now. This will provide a new catalyst for a lower VXX and higher XIV as long as VIX remains flat.
-JW
. . . . . . . . . . . . . .
Stay up to date by having posts sent directly to your
RSS feed or
Email.
Subscribe to:
Posts (Atom)