

We're now well into the second half of the year and XIV is sitting on a nice little gain of 28% YTD. But considering that the average annual return for XIV over the past two years is 114%, it is actually struggling a bit. So far this year the VXX weekly roll yield has averaged just -1.14% which will keep gains in check as illustrated by our XIV roll yield scatter plot (from my April post about reducing short volatility profit expectations). The current VXX Bias is only slightly negative, indicating a weak downward trend in VXX (weak upward trend for XIV) that is vulnerable to occasional spikes.
Over the past few weeks it increasingly appears as if the bulls may be losing momentum. Perhaps adding to the jitters is a chart of VIX seasonality that is currently making the rounds. I've included a chart below showing the average VIX from 2005-2013 compared to VIX in 2014.
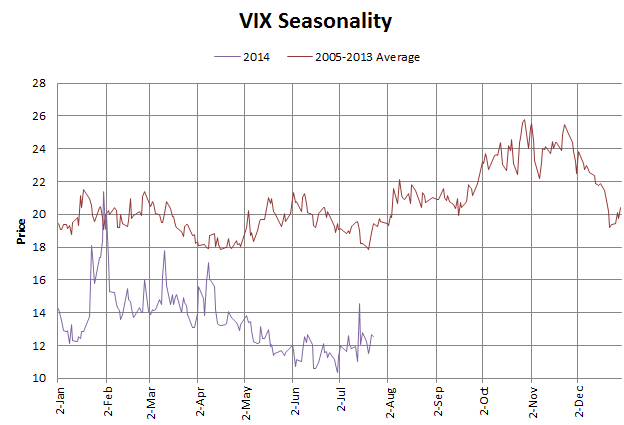
From the chart we can see that July, August, September and October see increases in VIX (on average). While this is somewhat insightful, the chart is distorted fairly heavily by elevated VIX levels during the second halves of 2007, 2008, and 2011. The distortion is so great that even if we look at seasonality of the VIX for every year back to 1990 we still see the same seasonality trends. Yet in many of those years we saw volatility remain flat or decrease in the second half of the year. It is critical to remember that each year is unique and we must trade the data in the environment that we are in rather than trading the average of historical data. We will need to wait for each day to unfold in order to gather objective data about the state of the current market and trade accordingly.
At this time there is no reason to get too aggressive shorting VXX given the small weekly roll yield. Often the best trade when there is a weak or neutral Bias is to wait for a stronger trend to be established and I think that makes a lot of sense here. Taking smaller positions in XIV as long as the VXX Bias is negative would not be a terrible trade but positions really need to be watched in case we start seeing bearish momentum pick up. The line in the sand for XIV appears to be $44.50 (it closed Monday at $44.08). If it can get above that level and hold XIV could see some more gains here soon.
