

The first quarter checkpoint of +59% set a great tone for the year while our July checkpoint of +91% YTD put us close to where we finished for the year after going through a volatile third quarter. Our equity curve for 2016 using a hypothetical portfolio is as follows:

Below is how our indicators performed when we sent our trade orders through Collective2's auto-trading platform (since launch in February 2016), echoing the above equity curves.1
VRP+VXX Bias ("Trading Volatility 1")


VXX Bias:


2016 will go down in the books as a below average for the VRP+VXX Bias strategy's +96%, while VXX Bias's +149% ranks in the top three among all backtest years.
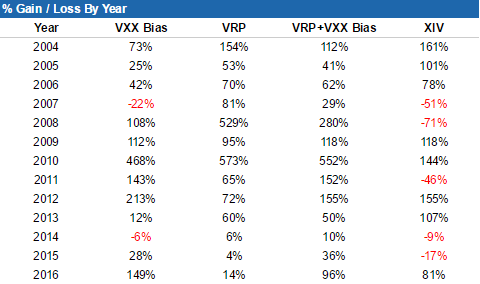

Updated statistics:


As always, each day's indicator values, buy/sell triggers, trade performance summary, and equity curves are tracked in the spreadsheets linked at the bottom of our Subscribe page. Additional information on our trading strategy and indicators can be found on our Strategy page.
1Note: As mentioned in our previous post, you will find differences between the ideal/hypothetical indicator performance and actual trading performance for the following reasons:
- The VRP+VXX Bias indicator ("Trading Volatility 1" on C2) was launched on C2 on Feb 2, 2016.
- The VXX Bias indicator was launched on C2 on Feb 19, 2016
- Both C2 systems traded only 72%-80% of portfolio equity until April 1. After April 1, both C2 systems trade at ~97.5% portfolio equity (the ideal/hypothetical model portfolios trade at 100% equity).
- The ideal/hypothetical performance does not account for trade commissions or subscriptions costs.
------------
Hypothetical and Simulated Performance Disclaimer
The results are based on simulated or hypothetical performance results that have certain inherent limitations. Unlike the results shown in an actual performance record, these results do not represent actual trading. Also, because these trades have not actually been executed, these results may have under- or over-compensated for the impact, if any, of certain market factors, such as lack of liquidity. Simulated or hypothetical trading programs in general are also subject to the fact that they are designed with the benefit of hindsight. No representation is being made that any account will or is likely to achieve profits or losses similar to these being shown. Hypothetical and backtest results do not account for any costs associated with trade commissions or subscription costs. Additional performance differences in backtests arise from the methodology of using the 4:00pm ET closing values for XIV, VXX, and ZIV as approximated trade prices for indicators that require VIX and VIX futures to settle at 4:15pm ET.
