Showing posts with label backwardation. Show all posts

Professional Volatility Strategies

Six years ago on this blog I wrote "XIV: When A "Sure Thing" Goes Bad, highlighting that the key drivers of Volatility ETPs are 1) the change in price of the relevant VIX futures contracts and 2) the term structure. While XIV no longer exists after last year's blow up, the message is still relevant to XIV's reduced leverage replacement, SVXY. In fact, an alternate title for this post could be "When a "Sure Thing" Goes Bad -- SVXY Edition"

Similar to XIV, SVXY is a fund that can be used as a play when an investor believes that volatility will decline. Although SVXY has only half the leverage that XIV had (-0.5x vs -1x), it can still produce strong gains and losses.

Below is a chart of the price of SVXY calculated as if it had the -0.5x leverage since 2004 (prices prior to the fund's official leverage reduction have been constructed by calculating the index value using 1st and 2nd month VIX futures data).


I've highlighted most of the larger price drops to help illustrate that SVXY is not a buy-and-hold security, even in its reduced leverage form. When the market structure changed in 2007 & 2008, SVXY still lost 70% of its value due to strong backwardation in VIX Futures.

As long-time readers know, the term structure of VIX futures is what drives various VIX funds, including SVXY, VXXB, UVXY, TVIX, VIXY, VIIX, and ZIV.

SVXY performs best in years where there is a strong and persistent contango, the condition where VIX is lower than VIX futures. The best way to measure the degree of contango for these products is to look at the weighted value of first and second month VIX futures as compared to spot VIX. Below is a graph of the weighted VIX futures values to spot VIX over the past 11 years.


The trendline here provides a way to filter out the daily noise and allows us to verify that the years in which SVXY performed the best experienced the largest and most persistent contango. On the flip side, the time frames that SVXY performed badly experienced backwardation and/or a small contango.

The fact that the term structure is such a strong driver of VIX ETPs is why professionals track this data closely. We track VIX Futures data and associated metrics shown on our website and use information from the term structure, price momentum, historical volatility, and the volatility of the VIX as inputs to our automated algorithms for buying and selling. The algorithm values are then used to trigger automated buying and selling of VIX ETPs and are emailed to subscribers. We track this data intraday as well and post it to both our Intraday Indicators page as well as our Daily Forecast page.

Our results (as tracked by a third party) substantially beat the S&P 500 over the long term. A screenshot of the VXX Bias and VRP+VXX Bias since we began tracking them on Collective2 are shown below:


VXX Bias:


VRP+VXX Bias ("Trading Volatility 1"):


Over the long term our approach can do well in both bull and bear markets, as seen in by our hypothetical backtest summary.


Clearly not all years are huge winners but the data shows that the use of the term structure data tends to be extremely valuable. If you are interested in checking out what we offer to subscribers you can view our Subscribe page.

One more note: We made a change to our VRP indicator in January 2019 so that it can now be used as a standalone strategy. As such, I am now having Collective2 track that as well. It can be found under Enhanced VRP.


------------
Hypothetical and Simulated Performance Disclaimer
The results are based on simulated or hypothetical performance results that have certain inherent limitations. Unlike the results shown in an actual performance record, these results do not represent actual trading. Also, because these trades have not actually been executed, these results may have under- or over-compensated for the impact, if any, of certain market factors, such as lack of liquidity. Simulated or hypothetical trading programs in general are also subject to the fact that they are designed with the benefit of hindsight. No representation is being made that any account will or is likely to achieve profits or losses similar to these being shown. Backtest results do not account for any costs associated with trade commissions or subscription costs.  Additional performance differences in backtests arise from the methodology of using the 4:00pm ET closing values for SVXY,  VXXB, and ZIV as approximated trade prices for indicators that require VIX and VIX futures to settle at 4:15pm ET.


. . . . . . . . . . . . . .

Stay up to date by having posts sent directly to your RSS feed or Email.

VXX Bias Forecast Performance Review, 2014 Year-to-Date

With one third of 2014 now behind us, it's a good time to take a look at year-to-date performance of our Bias strategy. The U.S. stock market has been mixed so far this year (through May 9, 2014) with the S&P 500 index gaining 1.6%,  the Russell 2000 down 4.8%, and the NASDAQ 100 down 1%. The VIX has lost 5.8% YTD although it has seen some wild swings already, gaining 56.3% in early February before returning back to where it started.

At Trading Volatility we focus on trading of VIX ETPs with most attention on VXX and XIV. Today we'll review the year-to-date performance of the VXX Bias forecasts, which are generated after each trading day at 4:30pm ET.
- For those of you who are unfamiliar with our daily Bias forecasts more information can be found on the Daily Forecast page.
- For backtested performance of the Bias strategy dating back to 2006 please see this post.

VXX Bias Indicator Performance, 2014 YTD (Data sheet with trade and performance details)
As usual, we'll review the performance of the indicators in two halves:
1) the "Negative VXX Bias" strategy which involves buying XIV whenever the VXX Bias is negative, and
2) the "Positive VXX Bias" strategy which involves buying VXX whenever the VXX Bias is positive.

1) Negative VXX Bias Strategy
The VXX Bias forecasts are designed to help traders identify the direction and magnitude of any headwinds/tailwinds in VXX and XIV that arise from the structure and momentum of the underlying VIX futures securities. So far this year the Bias forecasts have identified a key change in market structure in early January to give traders a chance to exit positions in XIV before the full 29% drawdown (see graph below). Confident investors sparked a stock market rebound to keep that drawdown contained, but we've seen a mostly sideways/choppy market with a neutral VXX Bias for the majority of the year. Long-time readers of our posts will know that a neutral Bias makes for little or no trading edge in VIX ETPs, making for a more difficult trading environment. However, in late April & early May we've seen the VXX Bias grow more negative and exit the neutral zone to drive new lows in VXX and drive price higher in XIV.
- As of May 9, XIV has returned 0% YTD vs +3% with the Negative VXX Bias strategy.


2) Positive VXX Bias Strategy
We've seen several moves to a positive VXX Bias this year but only one instance has lasted more than a handful of days. In the January instance the VXX Bias remained positive for 13 days, with VXX gaining over 30% before finally closing out a 10.8% gain. Most of the remaining VXX trades have ended with small losses in typical VXX behavior. 2014 has once again demonstrated that while VXX can see good short-term gains, they tend to be fleeting when the Bias quickly returns to negative.


------------
Hypothetical and Simulated Performance Disclaimer
TThe results are based on simulated or hypothetical performance results that have certain inherent limitations. Unlike the results shown in an actual performance record, these results do not represent actual trading. Also, because these trades have not actually been executed, these results may have under- or over-compensated for the impact, if any, of certain market factors, such as lack of liquidity. Simulated or hypothetical trading programs in general are also subject to the fact that they are designed with the benefit of hindsight. No representation is being made that any account will or is likely to achieve profits or losses similar to these being shown. Additional performance differences in backtests arise from the methodology of using the 4:00pm ET closing values for XIV, VXX, and ZIV as an approximated trade prices for indicators that require VIX and VIX futures to settle at 4:15pm ET.


. . . . . . . . . . . . . .

Stay up to date by having posts sent directly to your RSS feed or Email.

2014: Is It Still Profitable To Be Short VXX?

The markets are off to a bit of a rocky start to the year, particularly in the last couple of weeks. This is a distinct change of pace after a rather quiet end to 2013. VXX is +6.84% YTD after hitting a high of +30% on Wednesday. Will VXX see another year like 2012 and 2013 with losses of 60%? Or are we likely to see performance closer to 2011?

In this post I'll cover:
  • VIX Technical Review
  • Forecast Review
  • Trading Outlook
  • Trading Plan

VIX Technical Review 
VIX broke out above its 200SMA (14.4) on Jan 24 to start a rally that peaked at 21.48 seven days later. Since then it has quickly retreated and is approaching the 200SMA (now at 14.57) from the other direction. There are some other notable moving averages in the 14.4-14.9 area including the 100SMA, 50SMA, 60EMA, 90EMA and the lower envelope of the 10-2 Bollinger Band, as well as support levels established by previous VIX spikes. This suggests another 5% downside in VIX before support.


Taking a look at VIX futures (chart below), we went into backwardation for a day on Jan 24 and returned for six more days from Jan 30 through Feb 6. This was the longest string of backwardation we've seen since the the Aug 2011 selloff. The impact that backwardation and rising VIX futures have on the price movement of VIX ETF was made clear as XIV fell 30% from its Jan 22 close to its Feb 5 low. Although XIV has recovered somewhat and is down "only" 17% from Jan 22, it is still at risk for further declines should we see a move back to backwardation (also see "XIV: When a 'Sure Thing' Goes Bad").

This was a relatively mild volatility spike with VIX reaching just beyond its long term average of 19.8. Should this move in VIX continue to be more than just a blip on the radar, XIV could see some major losses. We're now back in a slight contango after Friday with Feb at 15.47 and March at 15.88. Feb VIX futures are 1% above spot VIX, which is a very small premium with six trading days left before Feb VIX futures expire. Typically you can expect VIX and expiring VIX futures to remain pretty well coupled as we approach expiration.


Forecast Review
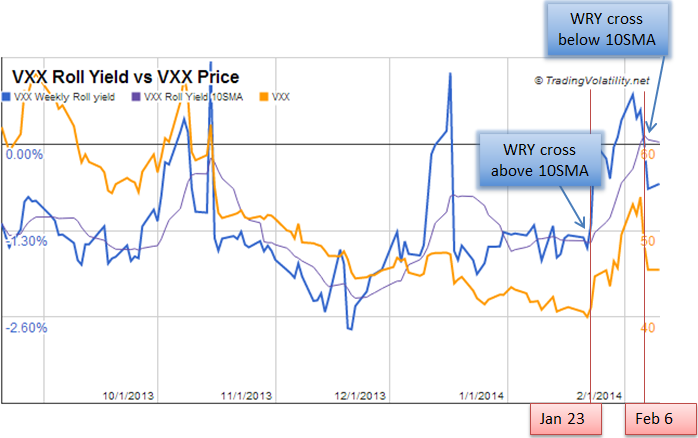
With the expectation for a more dynamic market in 2014, we've been using the signals from our WRY-10SMA indicator in addition to our Bias forecasting signals to guide us in trading. This provides us with additional signals to help avoid short-term drawdowns. After a choppy and sideways January we saw a move in the VXX Weekly Roll Yield above its 10SMA on January 23rd. Combining this with a confirming MACD signal in the VIX on that same day, we went long VXX, selling a potion on the 24th and the remainder on the 27th to lock in 11% gains. This turned out to be premature as the WRY stayed above its 10SMA for 7 more days and an additional 19% gain in VXX, but I find it's always good to take profits in VXX before they disappear. (Note: we will soon be updating our WRY-10SMA indicator to reduce the amount of signal noise by utilizing exponential moving averages.)


Looking at our Bias forecast over the past six months, the negative bias on VXX has been trending smaller resulting in a more difficult short of VXX.


Our VXX Spike Risk forecasts showed a substantially elevated risk over the last few of weeks rising from 25% up to 70%.


Trading Outlook 
First and foremost, let's respect the fact that the market is moving higher, the VXX bias is back to negative, and the VXX WRY is below its 10SMA. Follow this trend and see how we do with the various levels of resistance in the S&P 500 next week (1810 and 1820). Let's also respect the fact that XIV dropped 30% on a modest 5% pullback of the S&P. We are in a relatively old bull market which is rather complacent and investors are heavily leveraged while shorting volatility is a crowded market. We don't yet know if the emerging market issues from the past 2 weeks were just noise or the start of a real problem. When we hit a real problem somewhere down the line VIX will spike quickly and severely and I, for one, don't want to be heavy on the wrong side of the trade when it does.


Trading Plan
Please login to the Members' Forum to finish reading this article. If you're not yet a member you can join via the Subscribe page.


. . . . . . . . . . . . . .

Stay up to date by having posts sent directly to your RSS feed or Email.

VXX Continues To Drive Upward

VIX and VXX continued their upward trend today with the VIX futures term structure flattening substantially, making it impossible for XIV and ZIV to make any upward progress.

We've been playing in the danger zone ever since the VXX Spike Risk gauge from our Daily Forecasts moved above 5.0 on 5/28, with VXX +16% since then. The flattening of the term structure today marks another possible shift in sentiment and puts the curve at risk of flipping to backwardation.

We're at a point where it is critical that...

Continue reading this post on the Members' Forum

If you are not yet a member you can Subscribe for access to Trading Volatility+.


. . . . . . . . . . . . . .

Stay up to date by having posts sent directly to your RSS feed or Email.

The #1 Rule For Trading Volatility ETFs

Every couple weeks or so I see a new article from someone giving advice on how to trade volatility ETFs & ETNs such as XIV, VXX, SVXU, UVXY, and ZIV. Often the author will at least know that these products trade based on the VIX futures. But every once in awhile I'll see something more misguided, like the chart below. While it looks promising, once it is applied to historical data it does not deliver positive results.


For example, let's take a look at the period between August 2004 and May 2006 when VIX bounced between 10 and 16 (VIX on left axis; VXX on right axis). The chart says buy VXX below a VIX of 16.


The return for VXX during this time was -75%, a loss attributed to the fact that the front two months were in contango with a spread averaging 0.98.

Let's continue on to the next period, between May 2006 and Feb 2007 when VIX was spending much of its time between 10 and 12.  The result for VXX is a 57% loss, and again the reason is a contango term structure, with an average spread between front month futures (M1) and 2nd month futures (M2) of 0.85.


You may point out the spike in VXX from $1000 to $1350 on the left hand of the chart, which is a nice 35% gain. Unfortunately, if you were following the chart and buying XIV when VIX rose above 16 then you would have lost 30% over the next couple of weeks before almost breaking even if you held your position until VIX dropped below 16 again.

OK, so I can hear some of you saying that I'm cutting off the chart before VIX and VXX spikes. Take a look at the next period, from Feb 2007 to Feb 2011 when VIX spiked during the 2008 crash. During this time VIX was above 16. Since the chart above says buy XIV when VIX is above 16, I'll compare VIX (left axis) to the price of XIV (right axis).


The result is a 64% loss up until Dec 2007, followed by another 66% loss from Aug 2008 to Dec 2008, for a total of an 88% loss in XIV from 2/27/07 to 12/19/08.  At this point your position has essentially been demolished after this 21 month period. But let's give you the benefit of the doubt and say that you stayed solvent and held on to this position for the 4 year period until VIX dropped below 16 again. In that case you managed to almost break even in that XIV trade.

Looking at the term structure during this period, we find that between 2/27/07 and the bottom in 12/19/08 the term structure was in backwardation, with an average of a 0.67 spread between the first two months. Backwardation has the effect of making VXX rise and XIV fall.

From 12/20/08 to 3/24/2011, when the price in XIV goes up from 2 to 14 for an excellent 7x return, the term structure is back in contango with an average of 1.51 points between M1 and M2. Contango has the effect of making XIV rise and VXX fall.

At this point, the #1 rule in trading volatility-based ETFs should be clear: Follow The Term Structure.

The term structure is going to be the biggest driver of price for volatility-based ETPs over time. There are of course other factors that need to be taken into account when trading volatility ETPs in order to maximize your gains, but you will be able to trade these products pretty well just by following this rule.

To view the current term structure and other metrics that are critical to trading volatility ETPs, visit the VIX Futures Data page.


**Note: VXX and XIV price data prior to the funds' first trading days (1/30/2009 for VXX and 11/30/2011 for XIV) have been calculated by using the VIX short-term futures underlying index values derived from actual data of month 1 and month 2 futures.


. . . . . . . . . . . . . .

Stay up to date by having posts sent directly to your RSS feed or Email.

XIV: When A "Sure Thing" Goes Bad

A shift occurred in the market today with 1st and 2nd month VIX futures closing in a very slight backwardation of 0.05 points, with April at 16.65 and May at 16.60 (see data page). While this does not necessarily mean a continued selloff in XIV, I think it is very important for anyone who has grown accustomed to the seemingly unidirectional movement in XIV to understand that gains are not always a given.

We've seen a good run -- the result of a VIX that has declined from 26.66 on 6/1/12 down to six-year lows of 11.03 in March, as well as rolling futures in a contango term structure.  The result has been a staggering 200% gain over the past 9 months, and a 400% gain since 11/21/2011. It seems that money has been raining from the skies!

But remember that key drivers of VIX futures ETFs are 1) change in price of the relevant VIX futures contracts and 2) the term structure. Today we saw a shift in the flattening of the term structure which should signal a very loud "caution" to you.

When it comes to trading VIX futures ETPs it is critical to watch  for these changes in market structure.  Consider the following graph of XIV from 2004 through 2013 (prices prior to the fund launch have been by calculating the index value using 1st and 2nd month VIX futures data).


Those are some seriously painful losses! The thing that all of those declines have in common is a term structure shifting into backwardation. This is why it is so important to watch the term structure -- something that I watch daily by looking at the VIX Futures Data page (see 'M1-M2' for XIV and 'M4-M7' for ZIV) or the Daily Forecast (see the 'VXX Bias' gauge).

Exiting long XIV positions when the term structure flattens before a move to backwardation, can help you avoid these losses.


Today's closing term structure:


Tomorrow's VXX forecast: no bias from roll yield.  Spike risk remains elevated.:


. . . . . . . . . . . . . .

Stay up to date by having posts sent directly to your RSS feed or Email.

New Tool Available: VXX Daily Forecast

I provide quite a bit of essential data for trading volatility ETPs on the VIX Futures Data page, but if you are unfamiliar with the various VIX metrics it can be difficult to know where to look and how to interpret that information.

For me, the numbers on the page are critical since I look at them at the close of each day to determine whether I want to buy, sell, or hold various VIX ETFs. Since I often receive questions about whether it is time to be long/short XIV/VXX/UVXY, I decided to share a daily forecast tool for VXX which essentially summarizes my opinions on the direction of VXX for the next day of trading.

There are two components to this forecast, as illustrated by the gauges on the Daily Forecast page.

1) VXX Bias 
This gauge measures the bias of VXX and is largely determined by the roll yield (more on the roll yield in this post), which can be conceptualized as a headwind or tailwind. The gauge values are on a linear scale from -10 to +10, with a more negative reading indicating a stronger negative bias (headwind), and a more positive reading indicating a stronger positive bias (tailwind). Note that the gauge's range covers +3 and -3 standard deviations from the past 9 years of data for a total of 6σ.

2) VXX Spike Risk
The second forecast gauge reflects the likelihood of a significant spike in VXX. It takes data from the term structure of the front two months of VIX futures, the premium of front month futures over (or under) spot VIX, and recent moves in spot VIX. The gauge output is a scale of 0 to 10, with 0 being the lowest risk of a VXX spike, and 10 being the highest risk of a VXX spike.


Using the Gauges
Shorting VXX (or being long XIV) has been an excellent trade over the past several years due to a persistent state of contango in the VIX futures term structure. Simply being short VXX when there is a negative bias and long VXX when there is a positive bias has resulted in an average return of 116% per year over the past three years. The VXX Bias gauge will tell you which side of the trade you want to be on. Values toward the middle, and specifically in the yellow zone, mean that the term structure is relatively flat and you won't get much benefit from the roll yield with either a long or short position. It's important to note that while the bias gauge provides insight on the headwind/tailwind that VXX faces, VXX can still move up with a negative bias or down with a positive bias if the underlying futures move enough.

When you are short VXX it is always important to know what the risk is of the trade moving against you. While VXX loosely follows the daily action of the VIX, future VXX performance can be determined by the shape of the term structure in the 1st two months of VIX futures, and the value of these futures in relation to spot VIX. The readings on the gauge will spend a majority of time in the yellow region, signifying a medium risk of a spike. A move into the upper range of the yellow and red will make me increasingly nervous to be short VXX or long XIV.

Of course there are market/world events which will cause the VIX and VXX to spike dramatically. While this model cannot predict the unexpected, it does provide the ability to detect shifts in investor sentiment of known macro risks.

Below are some examples of what the gauge look like under various conditions (it might be helpful to look at the charts for VXX/XIV to see what price was doing during these times).

First is a series of five dates showing the period from late July/early August as the term structure flipped from contango to backwardation (some days omitted due to lack of substantial difference).

_________________________________


July 21, 2011
M1-M2: -1.65
M1 to VIX: 4%
VXX: $83.52


_________________________________


July 26, 2011
M1-M2: -1.15
M1 to VIX: -3%
VXX: $88.00


_________________________________


July 27, 2011
M1-M2: -0.40
M1 to VIX: -7%
VXX: $93.20


_________________________________

July 29, 2011
M1-M2: 0
M1 to VIX: -16%


VXX: $93.64


_________________________________

Aug 5, 2011

M1-M2: +2.95
M1 to VIX: -9%

VXX: $121.24


_________________________________________________


The next pair show a period of contango with a very high premium of M1 to VIX

_________________________________
Feb 17, 2012

M1-M2: -2.15
M1 to VIX: +27%


_________________________________________________


Lastly, a view of a very large contango spread:

_________________________________
March 16, 2012

M1-M2: -5.45
M1 to VIX: +12%


. . . . . . . . . . . . . .

Stay up to date by having posts sent directly to your RSS feed or Email.

Secrets of VXX: The Value of the Roll Yield

Most people who trade VXX realize that it faces constant headwinds caused by a term structure that is in contango roughly 90% of the time. However, something you may not know is just how big that headwind is at any given time. To help with this I have posted the weekly roll yields for short-term and med-term VIX futures securities on the VIX Futures Data page.


For more on where these numbers come from, continue reading below.

VXX tracks the performance of the first and second month VIX futures. However the actual dollar weight of each month held by VXX changes each day as iPath continuously rolls their portfolio in order to target a constant maturity weighted average futures maturity of 1 month. You can view the current status of these weights on the iPath site.

Summarizing the roll process as defined in iPath's 200+ page VXX prospectus:
1) At the beginning of the roll period all the weight is allocated to the first month contract.
2) On each subsequent business day a fraction of the first month VIX futures holding is sold and an equal notional amount of the second month VIX futures is bought. The quantity bought/sold depends on the number of business days in the roll period (the number of days varies but averages out to about 21).
3) The following roll period starts after all weight from the front month has been sold and the old second month VIX futures contract becomes the new first month VIX futures contract.

This process has a measurable effect on the price of VXX depending on the term structure.
When the term structure is in contango:
 - At the end of each day VXX must sell a quantity of first month shares and replace them with a quantity of second month shares at a higher value. The "buy high, sell low" scenario is a negative roll yield for the fund (assuming spot VIX is lower).

When the term structure is in backwardation:
- At the end of each day VXX must sell a quantity of first month shares and replace them with a quantity of second month shares at a lower value. The "buy low, sell high" scenario is a positive roll yield for the fund (assuming spot VIX higher).


The actual value of the roll yield depends on the differnce between and 1st and 2nd months VIX futures and spot VIX, and the number of days in the roll period (more days, smaller roll yield). 

The same process applies to inverse VIX futures products. In order to obtain the value of the roll yield for the inverse products (XIV/SVXY), just change a negative sign above to a positive, or vice versa.

In my trading, I like to be able to take advantage of this roll yield by holding securities that have a large positive roll yield, so our ideal timeframe for trades is on the order of weeks/months. Therefore, instead of looking at a daily roll yield we prefer to track the weekly roll yield, obtained from multiplying the daily roll yield by 5 (an approximation).

You can take a similar approach to approximate the roll yield for ZIV (inverse med-term VIX futures) using 4th and 7th month futures. The results of these calculations is what I have listed on the VIX Futures Data page.

To give the roll yield values some context, below I've listed the average, min, max, and standard deviation of the weekly roll yields for XIV (past 9 years) and ZIV (past 5 years):

XIV:
 avg:    +1.2%
 low:   -11.7%
 high:   +7.1%
 stdev: +1.7%

ZIV:
  avg:    +0.3%
  low:    -4.8%
  high:   +5.2%
  stdev: +0.5%


FAQs
Q: When does the roll period start?
A: The roll period starts on the Tuesday prior to the monthly CBOE VIX Futures Settlement Date (the Wednesday falling 30 calendar days before the S&P 500 option expiration for the following month.)


. . . . . . . . . . . . . .

Stay up to date by having posts sent directly to your RSS feed or Email.