

I was invited to join Bob Lang (options trading mentor at http://explosiveoptions.net, contributor to http://thestreet.com, and one of Jim Cramer's go-to technical experts on Mad Money) in a webinar yesterday. The recorded video has been posted online for anyone interested.
We had a great conversation, covering a wide variety of topics in 80 minutes. To help you find topics of interest, I've outlined our discussion along with approximate minute marks.
- Show intro (0:00)
- Bob's current market analysis (1:50)
- Into of Jay (10:15)
- Overview of Volatility (13:25)
- Role of actual market volatility in pricing of forward looking volatility (VIX) (17:18)
- What happens during recent, brief VIX spikes which quickly revert; impact of QE (24:00)
- Common misconceptions of VXX (30:28)
- Reasons for large blocks of VIX calls (36:15)
- Reason why actual volatility may be higher than implied volatility (39:40)
- Reasons for a rising VIX while the market is rising (41.45)
- Likelihood of seeing a VIX in the 90s again (45:00)
- Reasons for current low VIX regime (47:50)
- Recent pattern of buying XIV on dips and likelihood of continuation of this pattern (51:05)
- Letting data guide trading decisions (53:25)
- XIV technical analysis -- importance of 200-day moving average (54:40)
- XIV indicators (57:30)
- Possibility of rally in XIV in today's market & levels to watch for Friday (1:00:10)
- Do VIX levels have influence on whether equities go up or down (1:02:00)
- Preparing for Black Swan events (1:03:45)
- Current decision making for trading XIV in market Friday (1:08:00)
- Signals for start of new rally in XIV (1:10:30)
- Why Thursday's move in XIV was an indicator that VIX was overbid (1:11:45)
- Tour of free resources at http://tradingvolatility.net (1:14:00)
If you are interested in learning more about trading options from a technical expert, check out Bob's website at http://explosiveoptions.net/ and follow him on Twitter at @aztecs99.
Showing posts with label quantitative easing. Show all posts
Showing posts with label quantitative easing. Show all posts
Link to Recording of Webinar with Bob Lang and Jay Wolberg
-JW
. . . . . . . . . . . . . .
 Stay up to date by having posts sent directly to your
RSS feed or
Email.
Stay up to date by having posts sent directly to your
RSS feed or
Email.
Historical Context Of The VIX And VIX Futures Super-Cycle
VIX perked up in July as it rose 65% from a low of 10.32 up to over 17 in early August. This translated to gains of almost 30% in VXX, which tracks the daily movement of first and second month VIX futures.
Looking at our chart showing the past six months of VIX and VIX futures movement (from the VIX Futures Data page) there is a pronounced rise in all VIX futures over the month of July, bringing levels back up to those last seen in March.

Market participants have become accustomed to these VIX spikes and stick to a playbook of shorting volatility as it approaches 20. Recently this strategy has worked well but will it always work?
To help answer that question I've created an Archives page dedicated to historical data of VIX futures, containing a visual representation of VIX futures data over the past eight years to document the most recent VIX super-cycle.
On this page you can see how VIX futures traded from the calm market of 2006 through the chaos of 2008, all the way back to the calm of 2014. To give this data some context I've also added a selection of the more significant news events that have impacted the market. This allows you to see when various events happened and how they impacted the market. Some examples covered are:


Looking at our chart showing the past six months of VIX and VIX futures movement (from the VIX Futures Data page) there is a pronounced rise in all VIX futures over the month of July, bringing levels back up to those last seen in March.
Market participants have become accustomed to these VIX spikes and stick to a playbook of shorting volatility as it approaches 20. Recently this strategy has worked well but will it always work?
To help answer that question I've created an Archives page dedicated to historical data of VIX futures, containing a visual representation of VIX futures data over the past eight years to document the most recent VIX super-cycle.
On this page you can see how VIX futures traded from the calm market of 2006 through the chaos of 2008, all the way back to the calm of 2014. To give this data some context I've also added a selection of the more significant news events that have impacted the market. This allows you to see when various events happened and how they impacted the market. Some examples covered are:
- inversion of the bond yield curve in 2006,
- Bear Stearns downgrade & liquidity rumors,
- signing of the $700B financial bailout bill (Emergency Economic Stabilization Act of 2008),
- points when QE1, QE2, and QE3 begin and end,
- events leading up to the Flash Crash,
- Greek voters reject ruling parties in elections to put bailout at risk and possibly leave the Euro.
Some of the more enlightening graphs are:
Feb 2007 - Aug 2007 when mortgage defaults were rising as adjustable rate mortgage payments reset. The effect was a 50% rise in front month VIX futures over four months while in a contango term structure.
... Feb 2010 - Aug 2010 as Greece requested a bailout and fear of contagion spread across Europe.
... and Aug 2012 - Feb 2013 which shows the magic moment when the FOMC unveiled its open-ended QE3 program to place the most recent lid over volatility.
You can view all of the graphs on the Archives page. If you are a Trading Volatility+ subscriber you get the extra benefit of using interactive graphs for your research. If you are interested in becoming a subscriber you can do so at the Subscribe page.
-JW
. . . . . . . . . . . . . .
Stay up to date by having posts sent directly to your
RSS feed or
Email.
A Dose of Reality
Excitement from last week is continuing into this week with spot VIX (+34% today) closing well above front month futures (in fact it closed higher than 6th month futures!), a signal of market instability and a predictor of market sell offs, as I've previously discussed here.
Regardless of the "news events" that pundits say are driving the market, the reality of this market is that the FOMC's attempts to reflate an asset bubble by artificially suppressing interest rates through quantitative easing has forced everyone to chase returns in the stock market using heavy leverage. With ongoing issues of Japan's deflationary problems, Europe's insolvency and unemployment problems, and the U.S.'s deficit problem that no one is truly interested in solving, sooner or later the market will gets a dose of reality when evidence resurfaces to show once more that natural economic growth cycles, which include both growth and recession, cannot be suspended forever. When that happens it is only natural to see some selling.
While front month VIX futures closed in a very slight backwardation today I am not rushing to buy VXX here. Over the past three days VIX has made an oversized move has risen 29.4% compared to the S&P 500's -1.85% so I will be looking to buy XIV if the market can find some support in the next couple of days. However with front month VIX only at 17.65 there is no assurance that shorting VIX is a good play just yet. After hitting market highs after 7 straight weeks up we're likely to see choppy trading and an increase in realized volatility as traders look protect profits and perhaps try to unwind some positions.
A couple things to watch out for 1) Bernanke's semiannual testimony on the Monetary Policy Report starts tomorrow at 10:00am ET. A hawkish tone or a hint that QE is at it's useful limits could cause a bearish reaction similar to last Wednesday's selling after the FOMC minutes, and 2) The huge move in the Yen today is likely to crush Japan's stock market tomorrow and may shake investor confidence globally. Should bad news continue and the backwardation spread of M1 and M2 increase I will be long VXX.
A look at today's monster move across VIX futures:
-JW
. . . . . . . . . . . . . .
Stay up to date by having posts sent directly to your
RSS feed or
Email.
Spike in VIX Flattens VIX Futures Term Structure
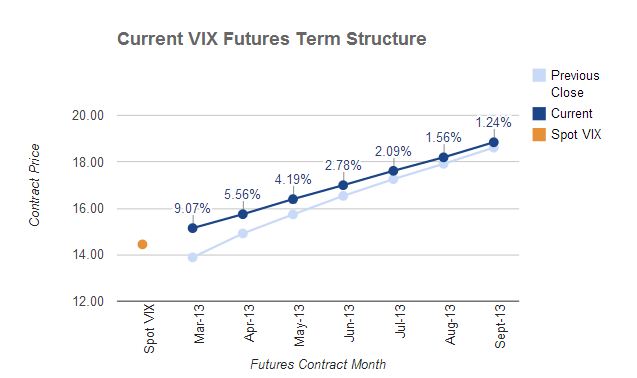
Last Wednesday I discussed how a new VIX futures front month (March) which was priced much higher than forward implied volatility (VIX) and historical volatility would likely cause XIV to continue higher in the short term. After moving up from that time to over 7% into yesterday's close, XIV pulled back hard today to close down -8.9% as the market sold off a bit and traders started looking for protection with put options with spot VIX moving up 19.25% to close at 14.68 (highest close since 1/2/13).
The VIX futures curve flattened notably today, with front month futures closing just 0.65 below second month futures and the difference between 1st month and 7th month compressed to just 3.7 points. This flattening often indicates that there is imminent downside in the broader market and could move VXX higher and XIV lower (although I don't like long being VXX without backwardation in first two months).
Term structure as of close today:

Coinciding with these technical signals, the market expressed its displeasure of the FOMC when they suggested that they may need to reduce the $85Billion of QE that goes into the market each month, citing that continued QE may prompt excessive risk and that the economy is on a moderate growth path. But whether the level of QE can actually be reduced without causing an equity market sell off and a costly rise in interest rates remains to be seen.
The VIX futures curve flattened notably today, with front month futures closing just 0.65 below second month futures and the difference between 1st month and 7th month compressed to just 3.7 points. This flattening often indicates that there is imminent downside in the broader market and could move VXX higher and XIV lower (although I don't like long being VXX without backwardation in first two months).
Term structure as of close today:
Coinciding with these technical signals, the market expressed its displeasure of the FOMC when they suggested that they may need to reduce the $85Billion of QE that goes into the market each month, citing that continued QE may prompt excessive risk and that the economy is on a moderate growth path. But whether the level of QE can actually be reduced without causing an equity market sell off and a costly rise in interest rates remains to be seen.
-JW
. . . . . . . . . . . . . .
Stay up to date by having posts sent directly to your
RSS feed or
Email.
Subscribe to:
Posts (Atom)