Say Hello To The New Uptrend In VIX And VIX Futures

Recap of the Week: 4/7/14 - 4/11/14
We saw a bit of weakness in the market last week with SPX down 3 of 5 days. VIX largely took the movement in stride, indicating that market participants continue to believe that dips will be bought, or at least, that this particular dip will be bought. We saw a signal to sell XIV / buy VXX on 4/10 as the VXX Bias and WRY MACD moved to positive on Thursday. The next day we saw VIX move as high as 17.85, before closing at 17.03 (+7%). This value of VIX is unusually low for a situation where SPX lost 3% over the course of 2 consecutive days (actual volatility for the week was 19.5). A VIX in the low/mid-20s would be more appropriate given historical comparisons (see this tweet after this Thursday's 2% sell off). No, the VIX is not "broken" here -- this just indicates that market participants do not see the need to buy puts to hedge their positions since the market has been in the pattern of quickly recovering from 5% dips in this new QE era.

Key Points & Outlook
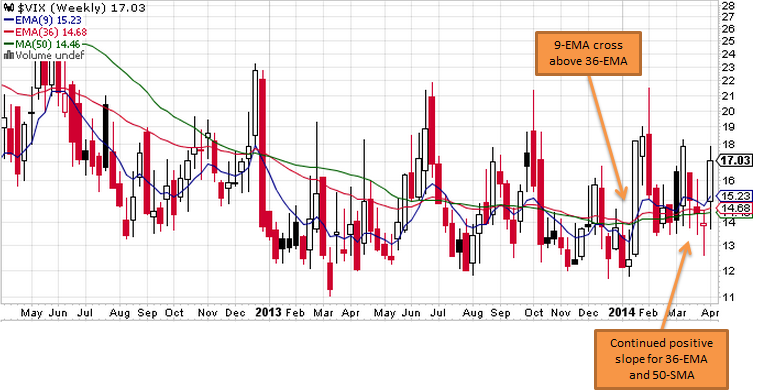
- After a false break lower the week of 3/31 - 4/4, VIX opened up higher this week, retraced to last week's close by Wednesday, then continued up to close at a 4-week high. This kept the longer-term uptrend that started the week of 1/21/14 intact. VIX weekly chart, below, shows the 9-ema rise above the 36-ema and test it twice so far. Also note the positive slope of the 36-EMA and 50-SMA.


- (Remaining Key Points & Outlook are available to Members only. Please login to the Members' Forum to read the remainder of this article. If you're not yet a member you can join via the Subscribe page.)
.
.


Major Shifts In Volatility Structure
We've watched many significant developments in the world of VIX and VIX futures unfold over the past two months and have been discussing these events and their implications in our Members' Forum. Below I've jotted down a summary of points from our recent posts to provide a glimpse of these conversations. 

(You can get access to the Trading Volatility Forum as well as our VIX Futures data and analytics for just $40/month. See the Subscribe page for details.)

2/24/14 - Theme: Rising actual volatility (HV20 & HV60) in the S&P 500 is a sign of an aging market and signifies shifting market sentiment.
- VIX has shown a bit of reservation over the latest two week rally.
- Do not expect XIV to behave in the same way in 2014 as it did in 2013; Expect choppy trading and weaker bounces like what we are seeing now. 

2/28/14  - Theme: Disappearance of the roll yield and a higher VIX base
- VXX Bias has narrowed -- almost no negative roll yield in VXX since early Feb
- VIX making higher lows, forming base in 14s
- Near-term VIX futures not selling off this time around. Trending up since Feb 18.
- Investors not selling VIX futures this time around

3/18/14  - Theme: Market Indecision and VIX Doubt In The Latest S&P Rally
- VXX Bias remains thinly negative
- VIX indicating lingering uncertainty despite S&P rally
- Continued rise in level of actual volatility in SPX, specifically HV60
- VIX/VXV bouncing above & below 0.92 threshold, indicating a high level of indecision

3/28/14  
- Continued indecision with VIX range-bound
- Watch for development of more negative VXX Bias

3/31/14 
- Break of the VXX trendline indicates lower prices to come

4/3/14 
- Weak market action in NDX and Russell 2000 prompts reduction in XIV position. Not a good time to aggressively short volatility.

4/4/14
- No show of fear yet despite selling in SPX. Watch out for further downside on Monday (4/7), 

4/10/14
- Change in VXX Bias and WRY MACD signal a move higher in VXX. 


. . . . . . . . . . . . . .

Stay up to date by having posts sent directly to your RSS feed or Email.

Shorting Volatility: Time To Reduce Profit Expectations for 2014

With XIV down 7.6% so far this year after seeing 100%+ annual returns in both 2012 and 2013, many have been asking "Is the short volatility trade dead in 2014?" While my terse answer is "not necessarily," we need to take a closer look at the various aspects of the VIX futures market in order to gain some insight on where VIX ETFs could be headed.

The idea of reduced profit expectations for XIV is actually not new. Although XIV gained 107% in 2013, its gains have slowed to just +36% over the past 12 months. While we've talked about this several times last year (here and here and here), today we'll talk about why and take a look at the current outlook.


VIX Futures
The daily price movement of XIV/SVXY, VXX and UVXY/TVIX are determined by the price of the front two months of VIX futures. In the chart below you can see both front month (M1) and second month (M2) VIX futures over the past 12 months.


Current values of M1 (14.85) and M2 (15.75) are generally in the lower-middle portion of the range. We've seen these M1 & M2 price levels with a similar ~1 point spread before. In fact, M1 and M2 are essentially unchanged from 12 months ago and we've seen the same levels six other times during the past year (4/26, 7/29, 9/16, 10/30, 12/3, and 12/19). On all of these occasions we've seen M1 and M2 continue to fall, providing an average gain for XIV of 9% over the next 1-2 weeks. These gains tend to be short-lived as multi-day volatility spikes have resulted in 15%+ drawdowns in XIV for 5 of the 7 instances (exception were 10/30/13 and 12/3/13). This doesn't mean that the same thing will happen this time around, but it does provide some interesting data points.

We can see these moves reflected in the 1-year chart of XIV, below. While VIX futures are essentially unchanged over the past 12 months, monthly expiring futures and the roll yield continue to provide fuel for gains in XIV, which is +36% over the past 12 months (and VXX is -47%). There's no reason this dance can't continue at this "slower" rate as long as M1 and M2 remain range bound under 20, but periodic drawdowns are likely to continue resulting in choppy trading.


As a relevant side note, 3 month actual volatility in the S&P 500 (HV60) has risen about 1.3 points over the course of the past five months. This often serves as an approximate lower-bounds for VIX, as we can see in the HV-IV chart below (see green circles). This means VIX is less likely to soon push back down into the 11.9/12.3 range we saw late last year.


VXX Roll Yield
In addition to looking at the relative position of front month VIX futures, we need to also look at the headwind/tailwind for the securities that arises from the roll yield. The roll yield is proportional to the difference between the 1st and 2nd month VIX futures. Below I've charted VXX's weekly roll yield (WRY) over the past two years.


You can see how the roll yield for VXX has been much less negative so far this year, providing for less of a headwind for VXX and less of a tailwind for XIV/SVXY. In fact, so far this year the average VXX WRY has been just -0.7% (which is +0.7% for XIV). To put that number in context, below is a table of the average XIV weekly roll yield for each of the past 9 years.

XIV: Average Weekly Roll Yield vs. Annual Return
Year Avg WRY Annual Return
2005 1.6% 101%
2006 1.4% 14%
2007 0.6% -35%
2008 -0.6% -71%
2009 0.9% 118%
2010 2.1% 144%
2011 0.5% -46%
2012 2.1% 154%
2013 1.6% 107%
2014  0.7% -8% (YTD)


The 2014 average WRY is more or less in the middle of the range between the low (-0.6%) and high (+2.1%). So why is this important? Because the return of VIX ETFs is largely dependent on the roll yield. as illustrated by a scatter plot for the above table.


You can largely expect that the return of XIV 2014 will end up somewhere along this line. Think about this chart for another minute. Essentially the trendline is telling us that XIV needs an average WRY of at least 0.5% to have a chance at being positive for the year. Factor in a few 25%+ XIV drawdowns and realistically it needs an average WRY of 1% to really provide some confidence in the trade. With VIX futures already quite compressed along the entire term structure, that 1% WRY will be difficult to maintain unless M1 is able to spend much more time in the 13s. This would imply a VIX down in the 11-12 range -- quite a tall order at the moment.

Outliers on the graph above are the result of either a) major differences of the yearly starting and ending values of M1 (i.e. in 2009 M1 went from 45 to 20), or b) large multi-day volatility spikes that cause major (50%+) drawdowns in XIV (e.g. 2006, 2007, 2011) which are difficult to recover from based on the dynamics of percentages (i.e. it takes a 100% gain to fully recover from a 50% loss). For reference, below is a chart showing the value of front month VIX futures over the past 9 years (note that while M1 is low compared to the recent 5 years, it is still higher than most of 2005 and 2006).


VXX Forecast Review
As I turn to look at our daily VXX Bias Forecasts history, below, you can see why we identify the area between -1 and +1 as a "neutral zone" (highlighted in yellow) which is subject to a certain amount of thrash. These are are times when VXX generally moves sideways and is more susceptible to spikes. After looking at this forecast history it's not much of a surprise to learn that neither VXX (-1.7%) nor XIV (-7.6%) have gone anywhere this year.


Summarizing the current situation for XIV (and VXX/UVXY):
  • We've seen a narrow XIV weekly roll yield so far in 2014, but it has been increasing lately to the point where it is back above 1%. If XIV is going to continue to see gains the WRY needs to stay above this level. 
  • VIX futures are at the lower end of the range over the past few years. They've been at these levels and can continue lower, but their downside is more limited than the upside at this point, making for a pretty non-ideal time to aggressively short volatility. 
  • XIV has the potential to continue to rise as VIX futures roll forward each month. The next expiration date is April 16th.


. . . . . . . . . . . . . .

Stay up to date by having posts sent directly to your RSS feed or Email.