Market Trends Point To Another Year of Volatility in 2019

Navigating the stock market in 2017 was easy. Shorting volatility was easy money. Picking individual stocks was easy and everyone was a brilliant strategist.

Then came 2018. The graph below highlights the fact that while less than 2% of assets were negative in 2017, 90% of assets are negative YTD in 2018 -- they highest percentage since... ever.


In another stark contrast to 2017, the short volatility ETPs have lost over 90% of their value in 2018 thanks to February's historic volatility spike. Last year's buy-and-hold everything strategy has been a bust across the board in 2018.

One of the few assets that lost in 2017 was volatility. Unsurprisingly, volatility has been one of the few bright spots in 2018 with the VIX index gaining +74% YTD and VXX +32% YTD.

What sort of market trends appear to be happening now and on tap for 2019?
 - decelerating corporate earnings [now]
 - late stages of the corporate debt cycle [now]
 - decline of demand for U.S. Treasuries [now]
 - quantitative tightening [now]
 - slowing global growth [now]
 - trend of de-dollarization [now]
 - eventual reverse to more quantitative easing [late 2019]

That's a recipe for another difficult year for a range of assets with a strong possibility of wide movements within the equity markets as the year progresses. As we stated three years ago, traders need data-driven, reliable, observable, and easy-to-follow trading rules in order to set themselves up for consistent success. One of the reasons that 90% of people fail to make money at trading is they fail to have a process-oriented trading plan. As the saying goes, "Plan the trade. Trade the plan."

We think that volatility will again be a major factor within the markets in 2019. Our playbook to make money on short-term investing opportunities is to maintain a quantitative-driven investment process for volatility ETPs that has made us successful for the past 7+ years. Specifically, our VXX Bias and VRP indicators.

Why? Because they perform exceedingly well over the long term by trading both long volatility using VXX (soon to be replaced by VXXB) and short volatility using SVXY (previously using XIV).


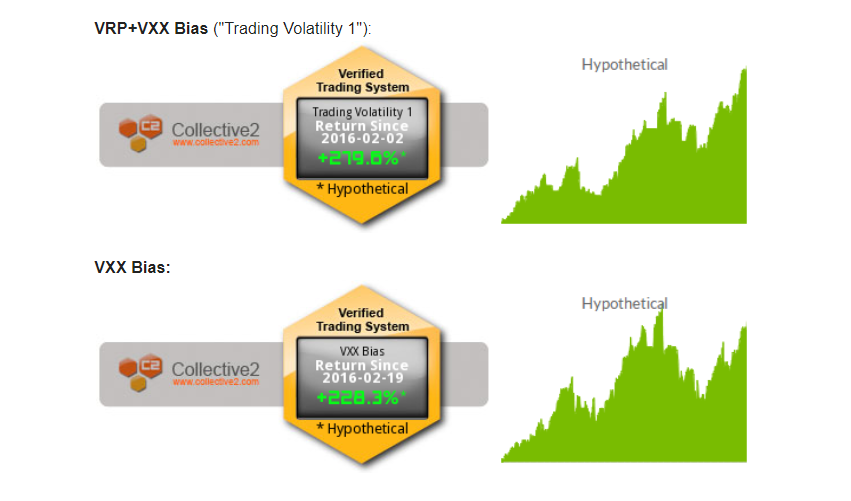
We've previously noted that 2018 has given us trouble and that hasn't changed much since July. Our automated trading performance as tracked by a third party now stands at -22% for VRP+VXX Bias and +33% for VXX Bias. While the year is not yet over, those numbers are lagging average performance in most years. However, when the average annual return is north of 50% per year under a range of varying market conditions with best performance occurring during market drawdowns, it makes sense to stick with a good thing.

We take the guesswork out of the investing equation with a solid set of objective tools to guide decision making. At Trading Volatility our algorithms conduct daily monitoring of a variety of volatility-related data to generate our VXX Bias and VRP indicators which provide us with objective information about the likely direction of volatility ETPs, including VXX, VXXB, UVXY, TVIX, SVXY and ZIV.

Our algorithms continuously measure market data throughout each trading day and publish results on our subscribers' Intraday Indicator page. Our automation also emails and publishes the indicators' final values at the end of each day so that subscribers' can track the indicator of their choosing and act accordingly.

If you find yourself struggling in this market check us out. Stop guessing what will happen and sign up for our daily data-driven indicators for volatility ETPs.  To learn more visit our Strategy page and Subscribe page or drop us a line via the Contact page.

------------
Hypothetical and Simulated Performance Disclaimer
The results are based on simulated or hypothetical performance results that have certain inherent limitations. Unlike the results shown in an actual performance record, these results do not represent actual trading. Also, because these trades have not actually been executed, these results may have under- or over-compensated for the impact, if any, of certain market factors, such as lack of liquidity. Simulated or hypothetical trading programs in general are also subject to the fact that they are designed with the benefit of hindsight. No representation is being made that any account will or is likely to achieve profits or losses similar to these being shown. Backtest results do not account for any costs associated with trade commissions or subscription costs.  Additional performance differences in backtests arise from the methodology of using the 4:00pm ET closing values for SVXY, VXX, VXXB, and ZIV as approximated trade prices for indicators that require VIX and VIX futures to settle at 4:15pm ET.


. . . . . . . . . . . . . .

Stay up to date by having posts sent directly to your RSS feed or Email.

A Visualization of VIX Implied S&P 500 Movement

U.S. Equities have taken a hit in the first four weeks of October with the S&P 500 declining as much as -9%. The VIX has risen ~108% this month up to 25.23 as of the close yesterday.

As we have noted previously, a VIX of 25 seems a bit low given the magnitude of the daily movements. Below you can see daily S&P 500 returns and their corresponding VIX values on the big sell-off days 10/10/18 (-3.3%) and 10/24/18 (-3.1%).


Based on this historical data, we could reasonably expect VIX to be trading in the 30-45 range. However, the market is apparently not expecting large rallies over the next month.

Recall that the VIX is an expression of expected annualized market volatility over the next 30 days.  A VIX of 25 means annualized move (up or down) of 25%. That value can be converted to monthly terms by dividing by the square root of 12, which yields an expected dispersion of the S&P 500 of 7.2%, or an implied range of 2463-2848.

We can convert that to a weekly and daily basis as well (divide by the square root of 52) to get a weekly dispersion of 3.5%, giving an implied range of 2558 to 2748 from yesterday's close. Interestingly, the 1-week dispersion target for $SPX based on $VIX after Oct 11th was 2820 (it came as high as 2817).

So perhaps $VIX isn't "too low" based on the magnitude of moves. Instead, it's more that investors don't expect a swift rally. Charting out the implied dispersion we can visualize the market's short-term expectations:


We can expect VIX to adjust accordingly as S&P 500 rises and falls. I'll provide updates within the Twitter thread on the subject.


. . . . . . . . . . . . . .

Stay up to date by having posts sent directly to your RSS feed or Email.

Have You Become Part of the Buy-and-Hold Equity Herd?

What is your investing game plan?

Has the S&P 500's longest bull market in history, with its 336% gain, finally converted you to become a part of the buy-and-hold equity herd?

Do you think the U.S. equity market is now immune from the carnage we've seen recently in Emerging Markets (MSCI Emerging Market Index is now off 20% from the January highs)? Have you cast aside the idea of a balanced investment portfolio?

You probably don't want to even think about it, but this bull market will not last forever.1 There will be an equity bear market here in the U.S. Non-diversified investors risk facing losses similar to that of the 2000 dot com bust and the 2008 financial crisis. The trap is that we don't know when. Any perma-bears left are still taking on losses, ineptly sitting in cash, or getting crushed by cryptocurrencies.

I personally like an aggressive Modern Portfolio Theory portfolio with a heavy weighting on equities -- but with one important modification. I like to carve out a small portion of my portfolio and allocate it to process-driven volatility trading which is long volatility at times and short volatility at other times.

This is the concept of including volatility as an asset and there are right and wrong ways to do it.

 - Wrong way #1: Buy-and hold a short volatility ETP.
XIV, which was the short volatility ETP of choice, suffered a catastrophic hit in February 2018 and investors lost hundreds of millions of dollars. Prior to going bust, XIV was the "can't lose" fund that returned over 10x since inception in 2010. Many people lost nearly all of their investment and various professional money managers were fired because they didn't know what they were doing and ignored the trouble signs of the underlying assets (VIX Futures). The calamity was so bad, that some brokers banned the purchase of short volatility ETPs to try to protect the average investor (a bit late for that, don't you think??).

- Wrong way #2: Buy-and-hold a long volatility ETP.
If buy-and-hold of the short side of volatility is wrong, then it must be better to buy-and-hold long volatility ETPs, such as VXX? No. VXX and the 2x leveraged UVXY & TVIX ETPs suffer long term decay thanks largely due to the fact that these funds track VIX Futures that are most often in a state of contango. Without getting technical, it should be sufficient to point out that VXX has gone from over $100,000 (adjusted for multiple reverse splits) to $27 over the course of its lifespan since inception 9 years ago.

- The Right Way #1: Our VRP+VXX Bias indicators.
Our volatility indicators put us in cash, long volatility, or short volatility based on daily measurements of various components within the volatility market in order to provides us with a "flexible" fifth asset (the others being equities, bonds, real estate, and commodities). To take diversification one step further, our volatility trading indicators are comprised of multiple unrelated component indicators. No single indicator is perfect and ours are no exception. When they don't agree on what to do we move our volatility allocation to cash (this by the way, is how we survived the February volatility market imploded).

One really nice aspect of our VRP+VXX Bias algorithms, in addition to being fully automated, is that they get us invested in an asset that is non-correlated with other assets. This is key to good diversification within a portfolio. Why? Because if you are diversifying using an asset that has high correlation to another invested asset, you are diversifying in name only while both assets carry roughly the same performance.

The flip side of the non-correlated asset coin, however, is the fact that there will be times when our indicators lag the market. 2018 has been pitiful so far and this can be frustrating if you are not looking at the big picture. And that is, a properly diversified and properly balanced portfolio will excel long term.

At any given time there will be a lagging asset within a diversified portfolio. Smart investors don't just scrap an asset class after a bad month/year -- they rebalance and focus on their process knowing that the next year is likely to result in an entirely different outcome. Otherwise, the investor is left with a portfolio that carries less diversification, greater risk, and a lower long-term return potential.


Our indicator's performance speaks for itself with actual automated signals and trades tracked by a third party since 2016, Collective2, here:


Looking further back using our modeling, we can see how VRP+VXX Bias ("Trading Volatility 1" performs in a variety of market conditions. By far, the best performing years for our indicators are when strong equity drawdowns occur, as can be seen in the chart below.


Trading Volatility+ subscribers have access to our VRP and VXX Bias indicators, our intraday indicator data, receive emails with preliminary and final change alerts for each of the indicators as well as our daily summaries, and interact with our private community of volatility traders in the forum. If interested, you can learn more about our services on our Subscribe page.

As always, each day's indicator values, buy/sell triggers, trade performance summary, and equity curves are tracked in the spreadsheets linked at the bottom of our Subscribe page. Additional information on our trading strategy and indicators can be found on our Strategy page.


Our indicators are also utilized by a volatility investment fund that is open only to accredited investors. If you think a managed volatility fund might better fit your needs please send a message through the Contact page.


Footnotes:
1 Smart people like to pretend they know why this bull market will end: the end of fiscal stimulus, rising interest rates, inflation, deflation, stagflation, global recession contagion, too much debt, high P/E ratios, trade wars, etc. No one knows the why or when and the average investor is unlikely to guess the when, and how it plays out, and be able to invest appropriately.

------------
Hypothetical and Simulated Performance Disclaimer
The results are based on simulated or hypothetical performance results that have certain inherent limitations. Unlike the results shown in an actual performance record, these results do not represent actual trading. Also, because these trades have not actually been executed, these results may have under- or over-compensated for the impact, if any, of certain market factors, such as lack of liquidity. Simulated or hypothetical trading programs in general are also subject to the fact that they are designed with the benefit of hindsight. No representation is being made that any account will or is likely to achieve profits or losses similar to these being shown. Hypothetical and backtest results do not account for any costs associated with trade commissions or subscription costs. Additional performance differences in backtests arise from the methodology of using the 4:00pm ET closing values for SVXY, VXX, and ZIV as approximated trade prices for indicators that require VIX and VIX futures to settle at 4:15pm ET


. . . . . . . . . . . . . .

Stay up to date by having posts sent directly to your RSS feed or Email.

Our Indicators Performance Update - YTD Through July 2018

After a strong 2016 (+96%) and 2017 (+126%), our performance in 2018 has been rather lackluster so far.

The biggest difference between this year and previous years is that the short volatility trade isn't working well. We've generally seen small roll yields, choppy market conditions with strong whipsaw reversals, and a VIX that closed the first day of the year with a record low close of 9.77 (47% below the median close on the first day of the year). As you can see in the graph below, the short volatility trade (via buying SVXY) has generally contributed between plus and minus 10% to performance of both indicators all year.


The long volatility trades (via buying VXX) helped the performance for the VXX Bias with YTD returns briefly exceeding 100% after February's historical VIX spike. Despite the initial success however, both VRP+VXX Bias and VXX Bias indicators gave back most of their long volatility gains after February, as shown in the graph below.


Putting both the long and short volatility trades together for 2018 we arrive at the following YTD performance (through July):
  • VRP+VXX Bias: -19%
  • VXX Bias: +37%
  • VRP: -93%
  • SVXY (buy and hold): -89%

This year's journey can be viewed in the equity curves below:


As we did during 2016 and 2017, we continue to send our automated trade alerts to Collective2's auto-trading platform. Below is how our indicators performed, as tracked by Collective2 (performance values and graphs here date back to launch in February 2016).1


Overall, I've been very happy with how the indicators have performed since they were launched on our website back in 2013, but this year has certainly been slow so far -- especially over the last four months. 


As usual, I've updated the values for monthly returns and they have been updated on our Strategy page, as well as below.


Note: Trading Volatility+ subscribers have access to our VRP and VXX Bias indicators, our intraday indicator data, receive emails with preliminary and final change alerts for each of the indicators as well as our daily summaries, and interact with our private community of volatility traders in the forum. If interested, you can learn more about our services on our Subscribe page.

As always, each day's indicator values, buy/sell triggers, trade performance summary, and equity curves are tracked in the spreadsheets linked at the bottom of our Subscribe page. Additional information on our trading strategy and indicators can be found on our Strategy page.

1Note: As mentioned in our previous post, you will find differences between the ideal/hypothetical indicator performance and actual trading performance for the following reasons:
- The VRP+VXX Bias indicator ("Trading Volatility 1" on C2) was launched on C2 on Feb 2, 2016.
- The VXX Bias indicator was launched on C2 on Feb 19, 2016
- Both C2 systems traded only 72%-80% of portfolio equity until April 1. After April 1, both C2 systems trade at ~97.5% portfolio equity (the ideal/hypothetical model portfolios trade at 100% equity).
- The ideal/hypothetical performance does not account for trade commissions or subscriptions costs.

------------
Hypothetical and Simulated Performance Disclaimer
The results are based on simulated or hypothetical performance results that have certain inherent limitations. Unlike the results shown in an actual performance record, these results do not represent actual trading. Also, because these trades have not actually been executed, these results may have under- or over-compensated for the impact, if any, of certain market factors, such as lack of liquidity. Simulated or hypothetical trading programs in general are also subject to the fact that they are designed with the benefit of hindsight. No representation is being made that any account will or is likely to achieve profits or losses similar to these being shown. Hypothetical and backtest results do not account for any costs associated with trade commissions or subscription costs. Additional performance differences in backtests arise from the methodology of using the 4:00pm ET closing values for SVXY, VXX, and ZIV as approximated trade prices for indicators that require VIX and VIX futures to settle at 4:15pm ET.


. . . . . . . . . . . . . .

Stay up to date by having posts sent directly to your RSS feed or Email.

February YTD Performance of Our Volatility Indicator

2018 has gotten off to a wild start in the volatility world as volatility exploded higher in early February. The VIX Index recorded a new all-time 1-day gain of 115.6%, followed by a new all-time 1-day loss of -58% on the following day. This resulted in quite a bit of carnage, completely destroying XIV and causing large losses in SVXY.

Below are the equity curves of all strategies YTD 2018, compared to XIV (SVXY).


Our VRP+VXX Bias indicator has taken a hit, with a -6% return after the first two months of the year. The picture looks a little bit worse on Collective2 due to some platform execution errors.

VXX Bias outperformed with a buy of VXX in mid-January, reaching unrealized gains of over 100% YTD before giving quite a bit back to end February at +46%.

SVXY obviously took a hit and is -90% YTD. The standalone VRP strategy got caught holding SVXY/XIV and is tracking at -90% as well.


Cumulatively, VRP+VXX Bias has recorded a +201% gain since we started tracking performance by a third party in February 2016. Meanwhile VXX Bias had a large leap and is now +345% since launch on Collective2.


The "Trading Volatility 1" system is the auto-traded version of our VRP+VXX Bias indicator which we have published daily to Trading Volatility+ subscribers for nearly five years now.

Trading Volatility+ subscribers have access to our VRP and VXX Bias indicators, our intraday indicator data, receive emails with preliminary and final change alerts for each of the indicators as well as our daily summaries, and interact with our private community of volatility traders in the forum. If interested, you can learn more about our services on our Subscribe page.


As always, each day's indicator values, buy/sell triggers, trade performance summary, and equity curves are tracked in the spreadsheets linked at the bottom of our Subscribe page


Additional information on our trading strategy and indicators, including the updated monthly performance tables, can be found on our Strategy page.


===
Hypothetical and Simulated Performance Disclaimer
The results are based on simulated or hypothetical performance results that have certain inherent limitations. Unlike the results shown in an actual performance record, these results do not represent actual trading. Also, because these trades have not actually been executed, these results may have under- or over-compensated for the impact, if any, of certain market factors, such as lack of liquidity. Simulated or hypothetical trading programs in general are also subject to the fact that they are designed with the benefit of hindsight. No representation is being made that any account will or is likely to achieve profits or losses similar to these being shown. Hypothetical backtest results do not account for any costs associated with trade commissions or subscription costs. Additional performance differences in backtests arise from the methodology of using the 4:00pm ET closing values for XIV, VXX, and ZIV as approximated trade prices for indicators that require VIX and VIX futures to settle at 4:15pm ET


. . . . . . . . . . . . . .

Stay up to date by having posts sent directly to your RSS feed or Email.

SVXY and UVXY To Be Re-Purposed Feb 28

Another big news item dropped in the volatility ETP world today. This one from ProShares, who is reducing target exposure for SVXY and UVXY.

Effective 2/28/18:
$SVXY will be a -0.5x volatility fund (previously -1x)
$UVXY will be a 1.5x volatility fund (previously 2x)

This is a similar move to what VMIN & VMAX announced earlier Monday. But while VMIN/VMAX kept their exposure at 1x and moved the duration of VIX futures out ~60 days, SVXY is just reducing its daily movement by half.
As I mentioned in my other post today, this is a more sensible way for a short volatility play. My main gripe is that SVXY went all the way down to -0.5x instead of something like -0.75. The reduced daily movement makes SVXY less attractive as the short vol ETP of choice, but it's nice that you can still buy options against it.

======

ProShare Capital Management LLC Plans to Reduce Target Exposure On Two ETFs

Bethesda, MD (February 26, 2018) – ProShare Capital Management today announced that the investment objective of two of its ETFs will change effective as of close of business on February 27, 2018.

ProShares Ultra VIX Short-Term Futures ETF (NYSE Arca: UVXY) will change its investment objective to seek results (before fees and expenses) that correspond to one and one-half times (1.5x) the performance of the S&P 500 VIX Short-Term Futures Index ("Index") for a single day. The Fund's investment objective currently is to seek results (before fees and expenses) that correspond to two times (2x) the performance of the Index for a single day. If the Fund were successful in meeting its new objective, on a day the Index rose 1%, the Fund should rise approximately 1.5%, before fees and expenses. Similarly, on a day the Index fell 1%, the Fund should fall approximately 1.5%, before fees and expenses.

ProShares Short VIX Short-Term Futures ETF (NYSE Arca: SVXY) will change its investment objective to seek results (before fees and expenses) that correspond to one-half the inverse (-0.5x) of the Index for a single day. The Fund's investment objective currently is to seek results (before fees and expenses) that correspond to the inverse (-1x) of the Index for a single day. If the Fund were successful in meeting its new objective, on a day the Index fell 1%, the Fund should rise approximately 0.5%, before fees and expenses. Similarly, on a day the Index rose 1%, the Fund should fall approximately 0.5%, before fees and expenses.
Certain regulatory approvals will be required for the Funds to permanently pursue these new investment objectives. In the event that such approvals are not obtained, the Funds will consider other courses of action.


. . . . . . . . . . . . . .

Stay up to date by having posts sent directly to your RSS feed or Email.

Pair of Volatility Funds to Be Re-Launched

We received huge news from REX Shares this morning, announcing that they are updating the objective of their VMIN & VMAX volatility pair. This looks like a really interesting, and much more sensible, play on volatility.

They are moving away from high-beta volatility ETFs (which are a high risk for termination when volatility spikes too much) to a product that trades on a daily basis somewhere between XIV and ZIV. The result should be a new VMIN fund that is less "boring" in movement as ZIV but also carry a fraction of the risk of a fund blow up and large drawdowns that were seen with XIV.

Announcement below, with emphasis added.


=========

The REX VolMAXX Long VIX Weekly Futures Strategy ETF (VMAX) and the REX VolMAXX Short VIX Weekly Futures Strategy ETF (VMIN) have filed supplemental registration statements that revise their stated Principal Investment Strategies. The Funds expect to invest primarily in VIX Futures Contracts with two to six months to expiration, rather than VIX Futures Contracts with less than one month to expiration as was previously the case.  Beginning on March 7, 2018, the Funds anticipate that they may begin investing in VIX Futures Contracts with greater than one month to expiration, and the Funds may therefore have exposure to VIX Futures Contracts with a weighted average time that is greater than, and which could be substantially greater than, one month.  Additionally, effective on or about April 25, 2018, the name of VMAX will change to “REX VolMAXXTM Long VIX Futures Strategy ETF”, and the name of VMIN will change to “REX VolMAXXTM Short VIX Futures Strategy ETF.”

Historically, the amount by which movements in the VIX Index1 have impacted the price of a VIX futures contract, also referred to as “beta,” has increased as a contract is closer to maturity.2 By increasing the weighted average of time to expiry of the VIX Futures Contracts held by the Funds, it is possible, and indeed likely, that the Funds’ “beta” to the VIX Index will decrease. Additionally, because the margin requirements for longer-dated VIX Futures Contracts tend to be lower than the margin requirements for shorter-dated VIX Futures Contracts,3 REX anticipates that this revision to the Principal Investment Strategy will allow the Funds to reduce their exposure to Underlying Funds and ETNs.4

The supplemental registration statements, information about the Funds’ holdings and additional information about the Funds can be found at https://www.volmaxx.com/


. . . . . . . . . . . . . .

Stay up to date by having posts sent directly to your RSS feed or Email.

XIV Is No More

Market action on Monday this week resulted in the all-time record for a 1-day spike in VIX at 115.6%. This also caused our beloved XIV to implode and alas, it no longer exists.

SVXY, a nearly identical product managed by ProShares, managed to survive the carnage although it lost most of its value. Other inverse volatility products including ZIV, VMIN, and XIVH are still around as well. We plan to move to SVXY and continue business as usual.

Speaking of business as usual, below is our performance of our indicators through Feb 8, 2018, as auto-traded on Collective2:


. . . . . . . . . . . . . .

Stay up to date by having posts sent directly to your RSS feed or Email.

Our 2017 Indicator Performance: +126%

We had a great 2016 with our primary indicator turning in a +96% gain, but 2017 was even better with a +126% gain. It was a bit of a wild journey, however, with a political headlines and threats of nuclear war popping up to cause some pretty strong drawdowns mid-year. Our equity curve for 2017 using hypothetical portfolios is as follows:


Below is how our indicators performed when we sent our trade orders through Collective2's auto-trading platform (performance values and graphs here date back to launch in February 2016), echoing the above equity curves.1

Both our VXX Bias and VRP+VXX Bias strategies were bested by a buy-and-hold approach with XIV in 2017 as it set a new record for best annual return. However, knowing that it is not a good idea to buy and hold XIV, I believe the VRP+VXX Bias performance was still rather good and it helped us to sell when it detected trouble coming our way.


Updated statistics:


Values for monthly returns have been tracked along the way and are updated on our Strategy page as well as below.


Trading Volatility+ subscribers have access to our VRP and VXX Bias indicators, our intraday indicator data, receive emails with preliminary and final change alerts for each of the indicators as well as our daily summaries, and interact with our private community of volatility traders in the forum. If interested, you can learn more about our services on our Subscribe page.

As always, each day's indicator values, buy/sell triggers, trade performance summary, and equity curves are tracked in the spreadsheets linked at the bottom of our Subscribe page. Additional information on our trading strategy and indicators can be found on our Strategy page.

1Note: As mentioned in our previous post, you will find differences between the ideal/hypothetical indicator performance and actual trading performance for the following reasons:
- The VRP+VXX Bias indicator ("Trading Volatility 1" on C2) was launched on C2 on Feb 2, 2016.
- The VXX Bias indicator was launched on C2 on Feb 19, 2016
- Both C2 systems traded only 72%-80% of portfolio equity until April 1. After April 1, both C2 systems trade at ~97.5% portfolio equity (the ideal/hypothetical model portfolios trade at 100% equity).
- The ideal/hypothetical performance does not account for trade commissions or subscriptions costs.

------------
Hypothetical and Simulated Performance Disclaimer
The results are based on simulated or hypothetical performance results that have certain inherent limitations. Unlike the results shown in an actual performance record, these results do not represent actual trading. Also, because these trades have not actually been executed, these results may have under- or over-compensated for the impact, if any, of certain market factors, such as lack of liquidity. Simulated or hypothetical trading programs in general are also subject to the fact that they are designed with the benefit of hindsight. No representation is being made that any account will or is likely to achieve profits or losses similar to these being shown. Hypothetical and backtest results do not account for any costs associated with trade commissions or subscription costs. Additional performance differences in backtests arise from the methodology of using the 4:00pm ET closing values for XIV, VXX, and ZIV as approximated trade prices for indicators that require VIX and VIX futures to settle at 4:15pm ET.


. . . . . . . . . . . . . .

Stay up to date by having posts sent directly to your RSS feed or Email.