

As a brief bit of background, leveraged ETFs seek to return the 2x or 3x the daily return of the underlying security. Below are some examples:
There is actually a known formula (**fellow math nerds can see the formula at the end of this post) for the return of a leveraged ETF. The critical variables that dictate leveraged ETF performance are:
1) The return of the underlying index (e.g. GDX, VXX, IWM)
2) The actual volatility of the underlying index
3) The amount of leverage (e.g. 1x, 2x, 3x)
4) The duration of the holding period
In quantifying the decay of these 2x and 3x ETFs I will start by mapping out #2, which is the actual volatility of the underlying index.
1) GDX: Actual volatility (HV20) range: 20 - 80

2) VXX: Actual volatility (HV20) range: 20 - 130


Using this information we can build tables and graphs to capture the various scenarios for the return of the underlying and compare that to the return of the leveraged ETF. (Note: All scenarios below assume a holding period of 3 months. Holding a fund for less than 3 months will see relatively less decay, while holding longer will experience greater decay.)
The return of the underlying index is listed in the first column while the various volatility rates are listed in the top row. The intersection of the index performance and its volatility rate gives the return of the leveraged ETF.
1) NUGT

For example, if GDX returned 5% over the holding period and had a 20% volatility rate, the return of NUGT would be 12.3%. Another scenario would be a holding period return in GDX of -12.5% and a volatility of 60%. This results in a return of -48.9% in NUGT. Note that cells colored red indicate that the leveraged ETF is underperforming 3x of the underlying index, while green cells are outperforming. It should be clear from the above that under most scenarios except for when actual volatility is low, a 3x fund will underperform.
The scenarios in graph above can be drawn in graph form for better understanding. The horizontal axis marks the return of the underlying index (GDX, IWM, etc) and the vertical axis marks the return of the leveraged ETF.
NUGT & TNA:

Leveraged inverse ETFs (DUST & TZA):

UVXY:
Because UVXY is only a 2x leveraged fund we a need different chart. However as shown above, the actual volatility of VXX is much higher as well which changes other input ranges.
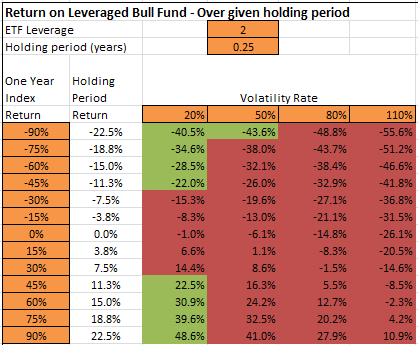
The resulting concept is the same however: the higher the actual volatility of the underlying (VXX), the more UVXY will underperform.
Consider someone who expect the market to crash while VIX spikes 80% and VXX spikes 60%. If the underlying volatility of VXX is 80% (which is likely to happen during market crash), UVXY only returns 12.7%. If VXX returned 80% but the actual volatility of VXX is 110% (it saw 120% in fall of 2011), the UVXY return is only -2.3%. Obviously UVXY is a very poor hedge to hold for any significant duration. It is really only beneficial for short duration trades if you have impeccable timing.
Here are the UVXY returns in graphical format:

Don't be lured by the potential return of these leveraged ETF products. Unless actual volatility of the underlying index is very low, you're likely to be just another victim of leveraged ETF decay.
_________
** Return (R) for a leveraged ETF is defined by:

Where x is the leverage ratio, σ is the volatility of the index, and T is the time
period the investment is held (source Cheng and Madhavan (2009) and Wang (2009))
