2026 Stock Market Survival Guide

 Labor Demand and Supply Under Pressure

The labor market is flashing unmistakable signs of strain:

  • August payrolls rose by just 22,000 jobs, the weakest monthly gain since the pandemic recovery period.

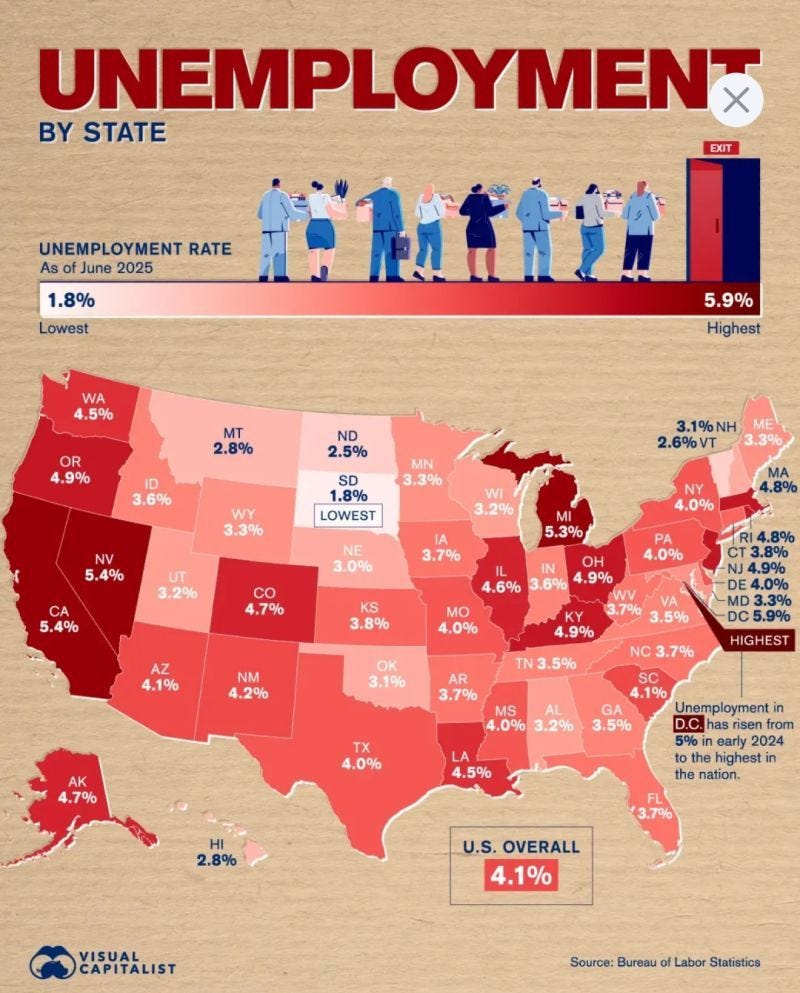
  • Unemployment climbed to 4.1%, the highest since 2021.

  • Prior months were revised downward, while goods-producing sectors in particular are showing contraction.

Looking ahead, firms are signaling caution. With cost volatility from escalating trade tensions, companies are leaning into restrained hiring, performance-based layoffs, subdued wage growth, and lower entry-level pay. We anticipate job creation will continue to weaken into 2026, with unemployment likely rising toward 4.8% by early next year.

For markets, this marks the early stages of a labor downshift driven not only by cyclical factors but also by structural disruptions from AI and automation.


Consumers: Resilient, But Eroding Fundamentals
Household spending has thus far defied the labor slowdown, but cracks are forming:

  • Retail sales rose 0.6% m/m in August, boosted by back-to-school shopping and activity among higher-income households.

  • Real volumes, however, grew only modestly, as tariffs and rising prices weigh disproportionately on lower- and middle-income households.

  • Tariff-induced price hikes are now filtering through, threatening to erode purchasing power.

While income gains have supported spending to date, the fundamentals are softening. Real personal consumption growth expected to decelerate from 2.8% in 2024 → 1.9% in 2025 → 1.2% in 2026, leaving consumption far more vulnerable to labor market weakness.


Inflation Reaccelerates
The August CPI confirmed a renewed acceleration in inflation:

  • Tariffs are beginning to lift goods prices, though passthrough remains gradual and uneven.

  • Service inflation stayed firm, driven by higher travel costs and a rebound in shelter.

  • Inflation momentum is broadening across both goods and services.

Looking forward, core PCE inflation to drift to ~3.2% by year-end, well above the Fed’s 2% target. Sticky inflation alongside labor weakness represents a difficult policy tradeoff: cut too soon, and inflation risks re-anchoring; stay tight too long, and the labor market damage deepens.


Read the rest of the article on Substack at https://tradingvolatility.substack.com/p/labor-market-weakens-inflation-reignites


. . . . . . . . . . . . . .

Stay up to date by having posts sent directly to your RSS feed or Email.

How To Immediately Improve Your Options Trading

Most people fail at the basics of trading options


In the fast-paced world of financial markets, options trading has gained tremendous popularity. The allure of potentially significant profits is undeniable, but the harsh reality is that many traders end up losing money due to a variety of factors. While trading options inherently involves risk, one of the major culprits behind losses is often the choice of a subpar trading platform. In this article, we'll delve into why selecting the right trading platform matters and how making the switch to Options AI can be a game-changer for your options trading journey.

Understanding the Importance of a Good Trading Platform

Why does your choice of trading platform play such a pivotal role in your trading success? A trading platform is where you analyze market data and manage your portfolio. A bad platform can lead to misunderstandings, confusion, and ultimately poor decision-making, leading to losses.

Visualize and Mitigate Risks with Options AI

Options AI understands that effective options trading requires clear visualization and risk assessment. One of the standout features of Options AI is its ability to help users visualize trades and comprehend the inherent risks. Through intuitive tools and visual representations, traders can gain a clearer understanding of how their chosen options positions may perform under various market scenarios. This empowers traders to make informed decisions and manage their risk exposure more effectively.

Highlighting the True Costs with Options AI

The Options AI platform goes beyond superficial option costs by providing insights into how much of a price move is already factored into the option premium. This transparency is essential because it helps traders assess whether an option is overpriced or underpriced relative to the expected market movement. Armed with this knowledge, traders can fine-tune their strategies and make more accurate predictions.

Beyond the Basics: Strategies and Expertise

Options AI distinguishes itself by catering to a diverse array of strategies that go beyond simple call and put buying. The platform is designed to generate trading strategies which offering a broader range of probabilities and profitability. Whether you're interested in spreads, straddles, or iron condors, Options AI provides the framework to explore and execute these strategies with confidence.

Awards Speak Louder Than Words

Recognition from industry experts speaks volumes about a trading platform's quality. Options AI proudly took home the title of "Best Brokerage for Options Trading" at the Benzinga FinTech Awards in 2022. This accolade underscores the platform's excellence in empowering traders to navigate the intricate world of options with precision.

Final Thoughts

The path to success in options trading hinges on the right tools and the right platform. By switching to Options AI, you're gaining a comprehensive solution that facilitates better visualization, risk assessment, and strategy of your trade ideas. Options trading is inherently challenging, but with the right platform like Options AI, you can significantly increase your chances of turning the tide in your favor. It's time to take your options trading journey to the next level.

You can use this link to obtain a special promotion of a free moth of trading on their platform.


. . . . . . . . . . . . . .

Stay up to date by having posts sent directly to your RSS feed or Email.

Simplify Your Trading: Join Our High-Performing Indicator Subscription Now

Trading Volatility recently celebrated 10 years of providing indicators for volatility ETPs (SVIX, XIV, SVXY, VXX, UVXY, UVIX) to retail traders and professional fund managers. 

Through the use of our indicators, we have been able to capitalize on changing market dynamics, including the great bull runs of 2016 and 2017, the 2018 "volmageddon" event,  and the 2021 pandemic panic

2023 has been another successful year for shorting volatility. So far, our indicators have outperformed nicely (through June 12) with four SVIX trades.

  • Our VRP+VXX Bias: +94%
  • SVIX (buy and hold): +69%


This performance was driven by 4 trades (one still in progress), with statistics captured below.


Over the past decade, we have repeatedly written about our volatility strategy and why we believe it is superior to any other trading strategy out there. It is worth reiterating here:

  1. We place swing trades, which amount to ~20 trades per year.
  2. We focus on the single asset class of volatility ETPs: $SVIX (inverse volatility) and $VXX (long volatility).
  3. Our strategy is relatively easy to replicate with automated preliminary notifications sent at 3:46 pm ET when we are about to place a trade at the close.
  4. The investment vehicles are highly liquid, making it easy to trade in size without causing significant market impact.


    Sounds promising. Are there any considerations to keep in mind?

  • High reward comes with high risk. As you may have heard volatility ETPs can exhibit volatility themselves.  
  • It is crucial to take prompt action upon receiving a trade alert, particularly after a sell signal, to avoid substantial drawdowns.
  • Psychologically, executing trades consistently can be challenging for many individuals.


Many investors tend to overcomplicate trading, bombarded daily by the latest stock trends, thinking they can profit by chasing memes.

If your performance is lagging and you seek to simplify your trading approach, now is an opportune time to reflect on your strategy and make necessary adjustments. For more information, please visit our Strategy page

We have extensively discussed why we favor volatility ETPs. This preference stems from their trading mechanism based on ever-shifting VIX futures weighting and their performance influenced by term structures. Since this concept may be unfamiliar to many, we have provided comprehensive write-ups and even offer a free e-book, along with the #1 rule for volatility ETPs

To explore our subscription options, please visit our Subscribe page. Given the valuable information provided, our subscription prices are remarkably affordable. Additionally, for those hesitant about long-term commitment, we offer day passes with full access to our site for as little as $5/day.

All in all, this year has been remarkably fruitful, and we eagerly anticipate what the future holds. Join us on our journey and witness firsthand the incredible potential our subscription offers. Subscribe now and embark on a path to trading success!


------------

Hypothetical and Simulated Performance Disclaimer
The results are based on simulated or hypothetical performance results that have certain inherent limitations. Unlike the results shown in an actual performance record, these results do not represent actual trading. Also, because these trades have not actually been executed, these results may have under- or over-compensated for the impact, if any, of certain market factors, such as lack of liquidity. Simulated or hypothetical trading programs in general are also subject to the fact that they are designed with the benefit of hindsight. No representation is being made that any account will or is likely to achieve profits or losses similar to these being shown. Hypothetical and backtest results do not account for any costs associated with trade commissions or subscription costs. Additional performance differences in backtests arise from the methodology of using the 4:00pm ET closing values for SVXY, VXX, and ZIV as approximated trade prices for indicators that require VIX and VIX futures to settle at 4:15pm ET.


. . . . . . . . . . . . . .

Stay up to date by having posts sent directly to your RSS feed or Email.

Looking For The Short Volatility Trade After +170% Year-To-Date

Markets have been made historic moves during these first few months of 2020. Here at Trading Volatility we have stayed focused on following the process of our trading systems to get off to an amazing start on the trading year.

Here is the performance of our indicators in 2020, through March 18th, as tracked by a third party (Collective2):

VRP+VXX Bias:   +170%


-  VXX Bias:   +238%


Subscribers to these blog posts have known since last September that something like this was coming, as I outlined in "The Once-A-Decade Volatility Trade" post. In that article I wrote

"Your opportunity is to join us now because once the next volatility spike it's too late. Our gains will be made and those without hedges in place will have lost. It's that simple."  

I'm sorry to say that it is now too late for non-subscribers to capture the full extent of this move.

However, there is still an opportunity to capture additional gains on upside from a long volatility trade (via VXX, UVXY, or TVIX) as well as "The Once-A-Decade Short Volatility Trade" which will happen after this current volatility spike runs its course.

In fact, as I've previously written in my Market Crash Protection post, our indicators successfully identify times when the market is strong and it is appropriate to short VXX (or buy an inverse ETF such as SVXY or the much-anticipated SVIX). The short volatility side of the trade is historically where most of our gains come from.

2020 has been a big year on the long volatility side of the trade and I expect it to be just as big on the short volatility side of the trade as we make our way through the Coronavirus (COVID-19) crisis.

These are difficult times and I believe that our automated trading process can be an enormous benefit to anyone who wants to be able to filter out the noise and emotional pitfalls of trading in this market.

As you know, I was not exaggerating when I said we will have the "Once A Decade Volatility Trade" and I am not exaggerating when I say we will have "The Once A Decade Short Volatility Trade."

Join us as a Trading Volatility+ subscriber so this next opportunity doesn't pass you up.


You can view what we offer to subscribers at our Subscribe page. Considering the information you get from our service, our subscription prices are actually ridiculously cheap. And for those who are afraid of commitment, we offer day passes with full access to our site for as little as $4/day.

To learn more visit our Strategy page. You can also view all the trades that our strategies have generated over the years by looking at the spreadsheets on the Results page or links to Collective2. We strive to be as transparent as possible with our service.

Free E-book:
If you'd like to learn more about our how volatility ETFs work you can read our free e-book, Fundamental Concepts and Strategies for Trading Volatility ETPswhich is available for free download. If you are curious about how our Bias forecasts work and why they have been successful in identifying long-term trends under a variety of market conditions, be sure to give this a read. It explains the basic concepts of VIX and VIX futures as well as the main price drivers of various volatility ETPs, including the popular funds VXX, VIXY, SVXY, UVXY, ZIV, and VXZ. I believe that the concepts outlined in the e-book are critical to understand if you're going to trade these products.
------------
Hypothetical and Simulated Performance DisclaimerThe results are based on simulated or hypothetical performance results that have certain inherent limitations. Unlike the results shown in an actual performance record, these results do not represent actual trading. Also, because these trades have not actually been executed, these results may have under- or over-compensated for the impact, if any, of certain market factors, such as lack of liquidity. Simulated or hypothetical trading programs in general are also subject to the fact that they are designed with the benefit of hindsight. No representation is being made that any account will or is likely to achieve profits or losses similar to these being shown. Hypothetical and backtest results do not account for any costs associated with trade commissions or subscription costs. Additional performance differences in backtests arise from the methodology of using the 4:00pm ET closing values for SVXY, VXX, and ZIV as approximated trade prices for indicators that require VIX and VIX futures to settle at 4:15pm ET


. . . . . . . . . . . . . .

Stay up to date by having posts sent directly to your RSS feed or Email.