SVXY and UVXY To Be Re-Purposed Feb 28

Another big news item dropped in the volatility ETP world today. This one from ProShares, who is reducing target exposure for SVXY and UVXY.

Effective 2/28/18:
$SVXY will be a -0.5x volatility fund (previously -1x)
$UVXY will be a 1.5x volatility fund (previously 2x)

This is a similar move to what VMIN & VMAX announced earlier Monday. But while VMIN/VMAX kept their exposure at 1x and moved the duration of VIX futures out ~60 days, SVXY is just reducing its daily movement by half.
As I mentioned in my other post today, this is a more sensible way for a short volatility play. My main gripe is that SVXY went all the way down to -0.5x instead of something like -0.75. The reduced daily movement makes SVXY less attractive as the short vol ETP of choice, but it's nice that you can still buy options against it.

======

ProShare Capital Management LLC Plans to Reduce Target Exposure On Two ETFs

Bethesda, MD (February 26, 2018) – ProShare Capital Management today announced that the investment objective of two of its ETFs will change effective as of close of business on February 27, 2018.

ProShares Ultra VIX Short-Term Futures ETF (NYSE Arca: UVXY) will change its investment objective to seek results (before fees and expenses) that correspond to one and one-half times (1.5x) the performance of the S&P 500 VIX Short-Term Futures Index ("Index") for a single day. The Fund's investment objective currently is to seek results (before fees and expenses) that correspond to two times (2x) the performance of the Index for a single day. If the Fund were successful in meeting its new objective, on a day the Index rose 1%, the Fund should rise approximately 1.5%, before fees and expenses. Similarly, on a day the Index fell 1%, the Fund should fall approximately 1.5%, before fees and expenses.

ProShares Short VIX Short-Term Futures ETF (NYSE Arca: SVXY) will change its investment objective to seek results (before fees and expenses) that correspond to one-half the inverse (-0.5x) of the Index for a single day. The Fund's investment objective currently is to seek results (before fees and expenses) that correspond to the inverse (-1x) of the Index for a single day. If the Fund were successful in meeting its new objective, on a day the Index fell 1%, the Fund should rise approximately 0.5%, before fees and expenses. Similarly, on a day the Index rose 1%, the Fund should fall approximately 0.5%, before fees and expenses.
Certain regulatory approvals will be required for the Funds to permanently pursue these new investment objectives. In the event that such approvals are not obtained, the Funds will consider other courses of action.


. . . . . . . . . . . . . .

Stay up to date by having posts sent directly to your RSS feed or Email.

Pair of Volatility Funds to Be Re-Launched

We received huge news from REX Shares this morning, announcing that they are updating the objective of their VMIN & VMAX volatility pair. This looks like a really interesting, and much more sensible, play on volatility.

They are moving away from high-beta volatility ETFs (which are a high risk for termination when volatility spikes too much) to a product that trades on a daily basis somewhere between XIV and ZIV. The result should be a new VMIN fund that is less "boring" in movement as ZIV but also carry a fraction of the risk of a fund blow up and large drawdowns that were seen with XIV.

Announcement below, with emphasis added.


=========

The REX VolMAXX Long VIX Weekly Futures Strategy ETF (VMAX) and the REX VolMAXX Short VIX Weekly Futures Strategy ETF (VMIN) have filed supplemental registration statements that revise their stated Principal Investment Strategies. The Funds expect to invest primarily in VIX Futures Contracts with two to six months to expiration, rather than VIX Futures Contracts with less than one month to expiration as was previously the case.  Beginning on March 7, 2018, the Funds anticipate that they may begin investing in VIX Futures Contracts with greater than one month to expiration, and the Funds may therefore have exposure to VIX Futures Contracts with a weighted average time that is greater than, and which could be substantially greater than, one month.  Additionally, effective on or about April 25, 2018, the name of VMAX will change to “REX VolMAXXTM Long VIX Futures Strategy ETF”, and the name of VMIN will change to “REX VolMAXXTM Short VIX Futures Strategy ETF.”

Historically, the amount by which movements in the VIX Index1 have impacted the price of a VIX futures contract, also referred to as “beta,” has increased as a contract is closer to maturity.2 By increasing the weighted average of time to expiry of the VIX Futures Contracts held by the Funds, it is possible, and indeed likely, that the Funds’ “beta” to the VIX Index will decrease. Additionally, because the margin requirements for longer-dated VIX Futures Contracts tend to be lower than the margin requirements for shorter-dated VIX Futures Contracts,3 REX anticipates that this revision to the Principal Investment Strategy will allow the Funds to reduce their exposure to Underlying Funds and ETNs.4

The supplemental registration statements, information about the Funds’ holdings and additional information about the Funds can be found at https://www.volmaxx.com/


. . . . . . . . . . . . . .

Stay up to date by having posts sent directly to your RSS feed or Email.

XIV Is No More

Market action on Monday this week resulted in the all-time record for a 1-day spike in VIX at 115.6%. This also caused our beloved XIV to implode and alas, it no longer exists.

SVXY, a nearly identical product managed by ProShares, managed to survive the carnage although it lost most of its value. Other inverse volatility products including ZIV, VMIN, and XIVH are still around as well. We plan to move to SVXY and continue business as usual.

Speaking of business as usual, below is our performance of our indicators through Feb 8, 2018, as auto-traded on Collective2:


. . . . . . . . . . . . . .

Stay up to date by having posts sent directly to your RSS feed or Email.

Our 2017 Indicator Performance: +126%

We had a great 2016 with our primary indicator turning in a +96% gain, but 2017 was even better with a +126% gain. It was a bit of a wild journey, however, with a political headlines and threats of nuclear war popping up to cause some pretty strong drawdowns mid-year. Our equity curve for 2017 using hypothetical portfolios is as follows:


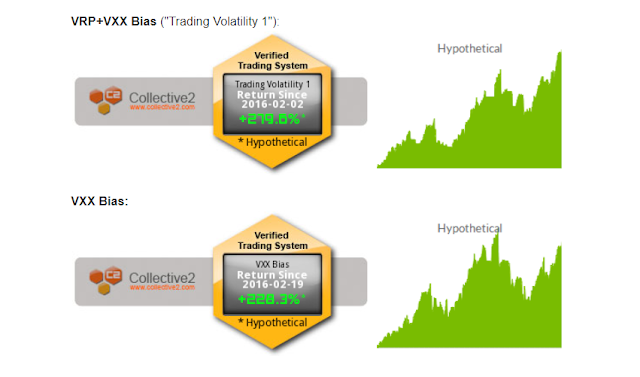
Below is how our indicators performed when we sent our trade orders through Collective2's auto-trading platform (performance values and graphs here date back to launch in February 2016), echoing the above equity curves.1

Both our VXX Bias and VRP+VXX Bias strategies were bested by a buy-and-hold approach with XIV in 2017 as it set a new record for best annual return. However, knowing that it is not a good idea to buy and hold XIV, I believe the VRP+VXX Bias performance was still rather good and it helped us to sell when it detected trouble coming our way.


Updated statistics:


Values for monthly returns have been tracked along the way and are updated on our Strategy page as well as below.


Trading Volatility+ subscribers have access to our VRP and VXX Bias indicators, our intraday indicator data, receive emails with preliminary and final change alerts for each of the indicators as well as our daily summaries, and interact with our private community of volatility traders in the forum. If interested, you can learn more about our services on our Subscribe page.

As always, each day's indicator values, buy/sell triggers, trade performance summary, and equity curves are tracked in the spreadsheets linked at the bottom of our Subscribe page. Additional information on our trading strategy and indicators can be found on our Strategy page.

1Note: As mentioned in our previous post, you will find differences between the ideal/hypothetical indicator performance and actual trading performance for the following reasons:
- The VRP+VXX Bias indicator ("Trading Volatility 1" on C2) was launched on C2 on Feb 2, 2016.
- The VXX Bias indicator was launched on C2 on Feb 19, 2016
- Both C2 systems traded only 72%-80% of portfolio equity until April 1. After April 1, both C2 systems trade at ~97.5% portfolio equity (the ideal/hypothetical model portfolios trade at 100% equity).
- The ideal/hypothetical performance does not account for trade commissions or subscriptions costs.

------------
Hypothetical and Simulated Performance Disclaimer
The results are based on simulated or hypothetical performance results that have certain inherent limitations. Unlike the results shown in an actual performance record, these results do not represent actual trading. Also, because these trades have not actually been executed, these results may have under- or over-compensated for the impact, if any, of certain market factors, such as lack of liquidity. Simulated or hypothetical trading programs in general are also subject to the fact that they are designed with the benefit of hindsight. No representation is being made that any account will or is likely to achieve profits or losses similar to these being shown. Hypothetical and backtest results do not account for any costs associated with trade commissions or subscription costs. Additional performance differences in backtests arise from the methodology of using the 4:00pm ET closing values for XIV, VXX, and ZIV as approximated trade prices for indicators that require VIX and VIX futures to settle at 4:15pm ET.


. . . . . . . . . . . . . .

Stay up to date by having posts sent directly to your RSS feed or Email.