Showing posts with label Weekly Roll Yield. Show all posts

The Most Important Chart For Trading Volatility ETPs

On April 5, 2014 I wrote an article titled Shorting Volatility: Time To Reduce Profit Expectations for 2014 which outlined why I thought it would be difficult for XIV (the fund which tracks the inverse daily return of volatility futures) to finish positive for 2014. When the article was published XIV had returned an impressive +547% over the past 28 months, as shown in the chart below.


Understandably, many people disagreed with my view, yet XIV finished the 2014 year -9%.

Later in 2014 (September) I wrote The End of an Era for the Market, in which I discussed how a choppy market that is no longer a reliable environment for shorting volatility had become the norm as the Fed concluded their QE program. XIV lost 37% of its value over the next four months and is currently down 30% since that post.

If it wasn't already clear, XIV is not a buy and hold security. It has returned -20% over the past year and -7% over the past two years. The environment is not the same as what it was in 2012 and 2013.

How did I make these calls?

Because returns in XIV are heavily dependent on the Weekly Roll Yield (WRY).

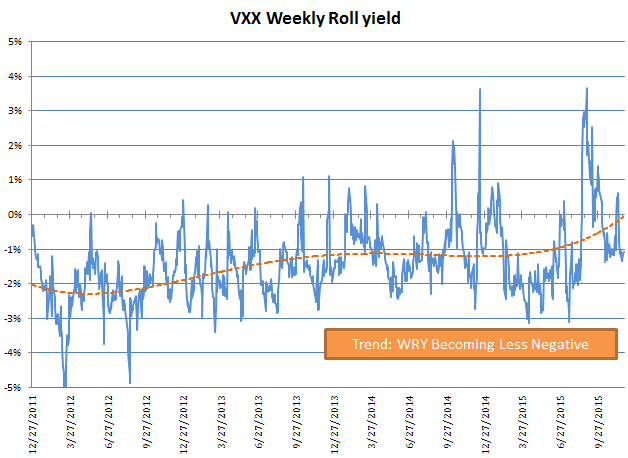
A major factor for the lower returns in the past two years comes from a smaller weekly roll yield that is used to propel XIV. The inverse of the XIV WRY is the VXX WRY (which comes from the difference between first and second month VIX futures). We track this important metric on our site, and as you can see in the graph below, the roll yield has moved from -2% to -1% over the past several years and has recently started to move toward 0%.


This is most important graph because the WRY serves as a headwind or tailwind to VIX ETPs. As the WRY approaches zero, trends become less stable and our advantage in trading XIV or VXX diminishes. Conversely, as the WRY moves away from zero trends become stronger.

Right now there is less of a headwind for VXX and less of a tailwind for XIV/SVXY. At this point in our old bull market we are also at high risk for the VXX WRY turning positive, which would give VXX a tailwind and XIV a headwind.

Revisiting our graph which compares the annual returns of XIV to the average Weekly Roll Yield (below), we can see why the WRY is so important.


Looking at the trendline we can see that with a fairly constant 1% WRY, we can generally expect XIV to return ~+25% per year. As the average WRY moves towards 2% we can expect XIV to return ~+120% per year.  At 0%, XIV is likely to return ~-60%. The recent shrinking of the WRY from 2% to 1% has an enormous impact on returns and that's why it is so important. A continued move of the WRY toward 0% or higher would be alarming to investors who plan to buy-and-hold XIV.

Because the WRY is such an important factor in the performance of VIX ETPs, our approach is to trade XIV and VXX using the WRY as a primary input for our VXX Bias and ZIV Bias indicators (our strategies are outlined here). While XIV is negative on the year, our VXX Bias indicator has put forth a performance of +33% YTD.

No credible trader will ever say that trading is easy, and that is doubly true when it comes to volatility. It requires a deep understanding of market forces, a solid process-oriented plan, and discipline in execution. In the current environment it will be more important than ever to stay on top of changing conditions.

We have been in the business of helping traders stay on top of the volatility market for three years now. We look forward to a fourth year of providing a variety of free data services throughout our website and are always happy to answer questions submitted through our Contact page. We also offer subscriber services to people looking for additional data, metrics, automated alerts and daily summaries, and access to a community of volatility traders. If you're interested, don't hesitate to drop us a line.


------------
Hypothetical and Simulated Performance Disclaimer
The results are based on simulated or hypothetical performance results that have certain inherent limitations. Unlike the results shown in an actual performance record, these results do not represent actual trading. Also, because these trades have not actually been executed, these results may have under- or over-compensated for the impact, if any, of certain market factors, such as lack of liquidity. Simulated or hypothetical trading programs in general are also subject to the fact that they are designed with the benefit of hindsight. No representation is being made that any account will or is likely to achieve profits or losses similar to these being shown. Additional performance differences in backtests arise from the methodology of using the 4:00pm ET closing values for XIV, VXX, and ZIV as approximated trade prices for indicators that require VIX and VIX futures to settle at 4:15pm ET.



. . . . . . . . . . . . . .

Stay up to date by having posts sent directly to your RSS feed or Email.

Trading Around VIX Seasonality

We're now well into the second half of the year and XIV is sitting on a nice little gain of 28% YTD. But considering that the average annual return for XIV over the past two years is 114%, it is actually struggling a bit. So far this year the VXX weekly roll yield has averaged just -1.14% which will keep gains in check as illustrated by our XIV roll yield scatter plot (from my April post about reducing short volatility profit expectations). The current VXX Bias is only slightly negative, indicating a weak downward trend in VXX (weak upward trend for XIV) that is vulnerable to occasional spikes.
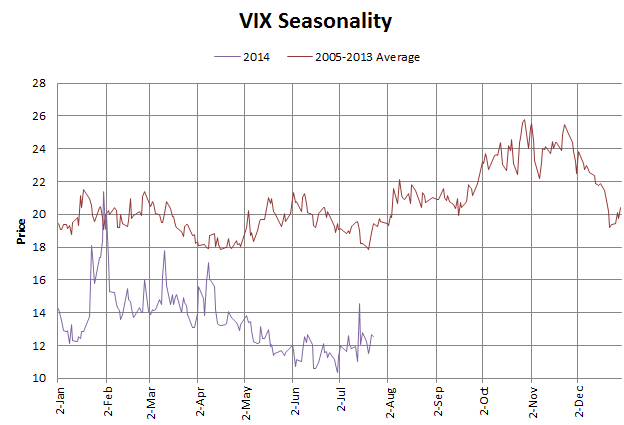
Over the past few weeks it increasingly appears as if the bulls may be losing momentum. Perhaps adding to the jitters is a chart of VIX seasonality that is currently making the rounds. I've included a chart below showing the average VIX from 2005-2013 compared to VIX in 2014.

From the chart we can see that July, August, September and October see increases in VIX (on average). While this is somewhat insightful, the chart is distorted fairly heavily by elevated VIX levels during the second halves of 2007, 2008, and 2011. The distortion is so great that even if we look at seasonality of the VIX for every year back to 1990 we still see the same seasonality trends. Yet in many of those years we saw volatility remain flat or decrease in the second half of the year. It is critical to remember that each year is unique and we must trade the data in the environment that we are in rather than trading the average of historical data. We will need to wait for each day to unfold in order to gather objective data about the state of the current market and trade accordingly.
At this time there is no reason to get too aggressive shorting VXX given the small weekly roll yield. Often the best trade when there is a weak or neutral Bias is to wait for a stronger trend to be established and I think that makes a lot of sense here. Taking smaller positions in XIV as long as the VXX Bias is negative would not be a terrible trade but positions really need to be watched in case we start seeing bearish momentum pick up. The line in the sand for XIV appears to be $44.50 (it closed Monday at $44.08). If it can get above that level and hold XIV could see some more gains here soon. 


. . . . . . . . . . . . . .

Stay up to date by having posts sent directly to your RSS feed or Email.

Shorting Volatility: Time To Reduce Profit Expectations for 2014

With XIV down 7.6% so far this year after seeing 100%+ annual returns in both 2012 and 2013, many have been asking "Is the short volatility trade dead in 2014?" While my terse answer is "not necessarily," we need to take a closer look at the various aspects of the VIX futures market in order to gain some insight on where VIX ETFs could be headed.

The idea of reduced profit expectations for XIV is actually not new. Although XIV gained 107% in 2013, its gains have slowed to just +36% over the past 12 months. While we've talked about this several times last year (here and here and here), today we'll talk about why and take a look at the current outlook.


VIX Futures
The daily price movement of XIV/SVXY, VXX and UVXY/TVIX are determined by the price of the front two months of VIX futures. In the chart below you can see both front month (M1) and second month (M2) VIX futures over the past 12 months.


Current values of M1 (14.85) and M2 (15.75) are generally in the lower-middle portion of the range. We've seen these M1 & M2 price levels with a similar ~1 point spread before. In fact, M1 and M2 are essentially unchanged from 12 months ago and we've seen the same levels six other times during the past year (4/26, 7/29, 9/16, 10/30, 12/3, and 12/19). On all of these occasions we've seen M1 and M2 continue to fall, providing an average gain for XIV of 9% over the next 1-2 weeks. These gains tend to be short-lived as multi-day volatility spikes have resulted in 15%+ drawdowns in XIV for 5 of the 7 instances (exception were 10/30/13 and 12/3/13). This doesn't mean that the same thing will happen this time around, but it does provide some interesting data points.

We can see these moves reflected in the 1-year chart of XIV, below. While VIX futures are essentially unchanged over the past 12 months, monthly expiring futures and the roll yield continue to provide fuel for gains in XIV, which is +36% over the past 12 months (and VXX is -47%). There's no reason this dance can't continue at this "slower" rate as long as M1 and M2 remain range bound under 20, but periodic drawdowns are likely to continue resulting in choppy trading.


As a relevant side note, 3 month actual volatility in the S&P 500 (HV60) has risen about 1.3 points over the course of the past five months. This often serves as an approximate lower-bounds for VIX, as we can see in the HV-IV chart below (see green circles). This means VIX is less likely to soon push back down into the 11.9/12.3 range we saw late last year.


VXX Roll Yield
In addition to looking at the relative position of front month VIX futures, we need to also look at the headwind/tailwind for the securities that arises from the roll yield. The roll yield is proportional to the difference between the 1st and 2nd month VIX futures. Below I've charted VXX's weekly roll yield (WRY) over the past two years.


You can see how the roll yield for VXX has been much less negative so far this year, providing for less of a headwind for VXX and less of a tailwind for XIV/SVXY. In fact, so far this year the average VXX WRY has been just -0.7% (which is +0.7% for XIV). To put that number in context, below is a table of the average XIV weekly roll yield for each of the past 9 years.

XIV: Average Weekly Roll Yield vs. Annual Return
Year Avg WRY Annual Return
2005 1.6% 101%
2006 1.4% 14%
2007 0.6% -35%
2008 -0.6% -71%
2009 0.9% 118%
2010 2.1% 144%
2011 0.5% -46%
2012 2.1% 154%
2013 1.6% 107%
2014  0.7% -8% (YTD)


The 2014 average WRY is more or less in the middle of the range between the low (-0.6%) and high (+2.1%). So why is this important? Because the return of VIX ETFs is largely dependent on the roll yield. as illustrated by a scatter plot for the above table.


You can largely expect that the return of XIV 2014 will end up somewhere along this line. Think about this chart for another minute. Essentially the trendline is telling us that XIV needs an average WRY of at least 0.5% to have a chance at being positive for the year. Factor in a few 25%+ XIV drawdowns and realistically it needs an average WRY of 1% to really provide some confidence in the trade. With VIX futures already quite compressed along the entire term structure, that 1% WRY will be difficult to maintain unless M1 is able to spend much more time in the 13s. This would imply a VIX down in the 11-12 range -- quite a tall order at the moment.

Outliers on the graph above are the result of either a) major differences of the yearly starting and ending values of M1 (i.e. in 2009 M1 went from 45 to 20), or b) large multi-day volatility spikes that cause major (50%+) drawdowns in XIV (e.g. 2006, 2007, 2011) which are difficult to recover from based on the dynamics of percentages (i.e. it takes a 100% gain to fully recover from a 50% loss). For reference, below is a chart showing the value of front month VIX futures over the past 9 years (note that while M1 is low compared to the recent 5 years, it is still higher than most of 2005 and 2006).


VXX Forecast Review
As I turn to look at our daily VXX Bias Forecasts history, below, you can see why we identify the area between -1 and +1 as a "neutral zone" (highlighted in yellow) which is subject to a certain amount of thrash. These are are times when VXX generally moves sideways and is more susceptible to spikes. After looking at this forecast history it's not much of a surprise to learn that neither VXX (-1.7%) nor XIV (-7.6%) have gone anywhere this year.


Summarizing the current situation for XIV (and VXX/UVXY):
  • We've seen a narrow XIV weekly roll yield so far in 2014, but it has been increasing lately to the point where it is back above 1%. If XIV is going to continue to see gains the WRY needs to stay above this level. 
  • VIX futures are at the lower end of the range over the past few years. They've been at these levels and can continue lower, but their downside is more limited than the upside at this point, making for a pretty non-ideal time to aggressively short volatility. 
  • XIV has the potential to continue to rise as VIX futures roll forward each month. The next expiration date is April 16th.


. . . . . . . . . . . . . .

Stay up to date by having posts sent directly to your RSS feed or Email.

2013 Performance Recap - Part 1

Now that 2013 has drawn to a close it's time for a performance recap of the Trading Volatility trading strategies. I'll be covering performance in two posts:

1) "WRY - 10SMA" Strategy
2) "Bias" Strategy for VXX & ZIV

1) "WRY - 10SMA" Strategy
Last month I introduced a strategy to enter and exit trades based on whether the Weekly Roll Yield (WRY) for VXX is above or below its 10-day moving average. It uses the chart from the VIX Futures Data page, shown below, to buy XIV (the inverse of VXX) when the WRY is less than its 10SMA (blue line is below the thin purple line), and buy VXX when the WRY is greater than its 10SMA (blue line is above the thin purple line).


1A) First, let's look at the performance of the "WRY < 10SMA" trade back to the inception of VXX in 2009 (data available here).

Cumulative Return Jan 30, 2009 - Dec 31, 2013
XIV: +1,691% 
"WRY < 10SMA": +1,870%


*Note: Results assume that gains are reinvested; prior to inception of XIV the inverse daily return of VXX is used to calculate the daily closing price of XIV. 

Focusing now on performance in 2013, you can see from the chart below that the "WRY < 10SMA" strategy under-performed a bit in a choppy market. One of the benefits of this strategy is that it helps to reduce drawdowns experienced by XIV and protect the portfolio in case the market sees a larger selloff, but it can come at the cost of missing out on "rebound gains" in an event-driven market. Hypothetical performance data available here.
  

Cumulative Return Jan 1, 2013 - Dec 31, 2013
XIV: +107% 
"WRY < 10SMA": +86%

"WRY < 10SMA" Trade Summary, 2013
  • # of Gains: 11
  • # of Losses: 10
  • Avg Return: +3.4%
  • Max Gain: +27.3%
  • Max Loss: -6.5%


Trade histogram of gains & losses for "WRY < 10SMA" in 2013:


1B) Next is the other half of the strategy, "WRY > 10SMA", in which VXX would be bought. As noted in my introductory post on this strategy, the gains obtained using this strategy in the early part of the trade are almost always gone by the time the WRY crosses back below the 10SMA. Because of this it makes sense to close trades early or skip this half of the trade altogether (hypothetical performance data available here).


"WRY > 10SMA" Trade Summary, 2013
  • # of Gains: 6
  • # of Losses: 13
  • Avg Return: -2.2%
  • Max Gain: +7.9%
  • Max Loss: -11.5%

Trade histogram of gains & losses for "WRY > 10SMA" in 2013:


In my next post I'll cover the performance of the "Bias" strategies (from our Daily Forecasts) for both VXX and ZIV .


------------
Hypothetical and Simulated Performance Disclaimer
The results are based on simulated or hypothetical performance results that have certain inherent limitations. Unlike the results shown in an actual performance record, these results do not represent actual trading. Also, because these trades have not actually been executed, these results may have under- or over-compensated for the impact, if any, of certain market factors, such as lack of liquidity. Simulated or hypothetical trading programs in general are also subject to the fact that they are designed with the benefit of hindsight. No representation is being made that any account will or is likely to achieve profits or losses similar to these being shown. Additional performance differences in backtests arise from the methodology of using the 4:00pm ET closing values for XIV, VXX, and ZIV as an approximated trade prices for indicators that require VIX and VIX futures to settle at 4:15pm ET.


. . . . . . . . . . . . . .

Stay up to date by having posts sent directly to your RSS feed or Email.