A Dose of Reality

Excitement from last week is continuing into this week with spot VIX (+34% today) closing well above front month futures (in fact it closed higher than 6th month futures!), a signal of market instability and a predictor of market sell offs, as I've previously discussed here.

Regardless of the "news events" that pundits say are driving the market, the reality of this market is that the FOMC's attempts to reflate an asset bubble by artificially suppressing interest rates through quantitative easing has forced everyone to chase returns in the stock market using heavy leverage. With ongoing issues of Japan's deflationary problems, Europe's insolvency and unemployment problems, and the U.S.'s deficit problem that no one is truly interested in solving, sooner or later the market will gets a dose of reality when evidence resurfaces to show once more that natural economic growth cycles, which include both growth and recession, cannot be suspended forever.  When that happens it is only natural to see some selling.

While front month VIX futures closed in a very slight backwardation today I am not rushing to buy VXX here. Over the past three days VIX has made an oversized move has risen 29.4% compared to the S&P 500's -1.85% so I will be looking to buy XIV if the market can find some support in the next couple of days.  However with front month VIX only at 17.65 there is no assurance that shorting VIX is a good play just yet. After hitting market highs after 7 straight weeks up we're likely to see choppy trading and an increase in realized volatility as traders look protect profits and perhaps try to unwind some positions.

A couple things to watch out for 1) Bernanke's semiannual testimony on the Monetary Policy Report starts tomorrow at 10:00am ET. A hawkish tone or a hint that QE is at it's useful limits could cause a bearish reaction similar to last Wednesday's selling after the FOMC minutes, and 2) The huge move in the Yen today is likely to crush Japan's stock market tomorrow and may shake investor confidence globally. Should bad news continue and the backwardation spread of M1 and M2 increase I will be long VXX.

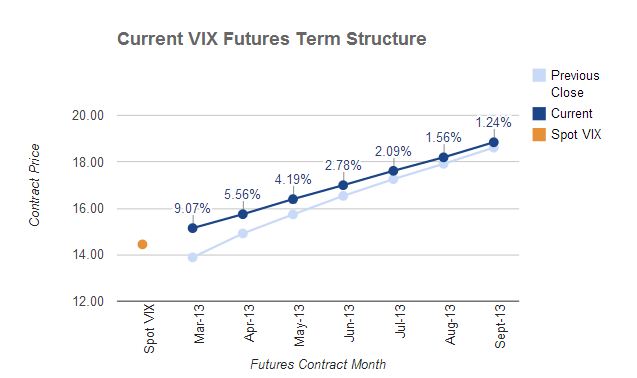
A look at today's monster move across VIX futures:


. . . . . . . . . . . . . .

Stay up to date by having posts sent directly to your RSS feed or Email.

The Return of Volatility: Week in Review 2/19 - 2/22

Things started to get a bit wild in the equity markets last week. After the overly-quiet week of  Feb 11-15 where realized volatility for S&P 500 during the week (HV5) hit a low 1.7, VIX picked up a bit gaining 12.9% on the week after marking a new low of 12.08 on Monday. By the end of the week HV5 was all the way up to 14.2!

VIX futures lagged spot VIX, remaining tame in comparison with only front month futures showing any sign of concern (see term structures below). However, this movement of M1 did result is a marked reduction of contango to second month and is a signal that VXX is likely to head higher, as I noted last Wednesday.


. . . . . . . . . . . . . .

Stay up to date by having posts sent directly to your RSS feed or Email.

Spike in VIX Flattens VIX Futures Term Structure

Last Wednesday I discussed how a new VIX futures front month (March) which was priced much higher than forward implied volatility (VIX) and historical volatility would likely cause XIV to continue higher in the short term. After moving up from that time to over 7%  into yesterday's close, XIV pulled back hard today to close down -8.9% as the market sold off a bit and traders started looking for protection with put options with spot VIX moving up 19.25% to close at 14.68 (highest close since 1/2/13).

The VIX futures curve flattened notably today, with front month futures closing just 0.65 below second month futures and the difference between 1st month and 7th month compressed to just 3.7 points. This flattening often indicates that there is imminent downside in the broader market and could move VXX higher and XIV lower (although I don't like long being VXX without backwardation in first two months).

Term structure as of close today:


Coinciding with these technical signals,  the market expressed its displeasure of the FOMC when they suggested that they may need to reduce the $85Billion of QE that goes into the market each month, citing that continued QE may prompt excessive risk and that the economy is on a moderate growth path. But whether the level of QE can actually be reduced without causing an equity market sell off and a costly rise in interest rates remains to be seen.


. . . . . . . . . . . . . .

Stay up to date by having posts sent directly to your RSS feed or Email.

What To Do Now? Historical Volatility Falls Under 10 As We Reach Another VIX Futures Rollover Day

VIX futures rolled over today with February futures expiring and March becoming front month. With March as front month the situation looks like this (data can be found on my market data page):

- Front month futures (M1) are 13% above spot VIX and 33% higher than actual realized volatility over the past 3 months (HV63).
- Actual volatility over the past 30 trading days (HV30) has dropped to 9.93, which is 30% lower than spot VIX
- The first month and second month (M1-M2) are in contango with a spread of -0.95, giving XIV a slight bullish bias
- The 4th and 7th month (M4-M7) are in contango with a spread of -1.8, giving ZIV a bullish bias

From the information above you can see that M1 is pretty overpriced when compared to forward volatility (VIX) and historical volatility, meaning that there is still room for XIV (inverse short-term VIX futures) and ZIV (inverse med-term VIX futures) to move higher.

However, now that we are halfway through the 7th straight week of gains on the S&P 500 and VIX futures have pressed down to levels not seen in over half a decade, I'm not finding the risk/reward in my typical XIV and ZIV trades to be justified.

There is the theory that since VIX is so low it makes sense to be long VXX (short term VIX futures). This may seem like a good idea but it is in fact a money loser 90% of the time for reasons I've previously explained here.

I've posted several trades on this blog (two January and one February), which at 13.4% have returned roughly twice that of the S&P 500 this year. At this point I feel there is little reason to chase gains at multi-year S&P 500 highs.

Which leaves me with option 3: doing nothing. I believe that you don't always have to be in a trade and it is necessary to patiently wait for an opportunity where you have a good setup. Stay tuned.


. . . . . . . . . . . . . .

Stay up to date by having posts sent directly to your RSS feed or Email.

VIX Futures Weekly Wrap: New 67-Month Low in Historical Volatility (HV126)

It seems that with every week that goes by volatility sets a new record low of some sort.  This week was no exception as actual realized (historical) volatility of the S&P 500 over the past six months (HV126) hit 11.34, a 67-month low.

Spot VIX edged up on the week to 13.02 (+0.9%) while VIX futures all along the curve were pushed lower, with the spread of the term structure at the front of the curve (months 1 and 2) moving wider to -1.3 while the back end (months 4 and 7) compressed to -1.95.

Term structures:


XIV and ZIV remain bullishly biased given that the term structure is in contango and historical volatility continues to decline. As I mentioned in my article this week at Seeking Alpha, VIX can certainly move lower from here and take VIX futures and VXX with it. However, the risk/reward on inverse VIX plays such as XIV and ZIV is currently not very appealing and should be owned with extreme caution.

Weekly VIX ETF scoreboard:
- VXX:     -0.43%
- UVXY:  -1.04%
- XIV:      +0.32%
- ZIV:       +0.93%
- S&P 500: +0.31%

As a reminder, you can always see the current VIX futures term structure, past VIX futures data, and historical volatility on my VIX Futures Data page.


. . . . . . . . . . . . . .

Stay up to date by having posts sent directly to your RSS feed or Email.

Various Market Notes

The S&P 500 oscillated around 1510 today closing just barely in the green (again) to drive historical volatility back down a bit. It wouldn't be surprising to see VIX dip back in to the 12s with more days like this.

VIX futures roll over next Wednesday as February (current front month) VIX futures expire. There is currently a 5% premium of front month futures over spot VIX.  This premium tends to approach zero as we get closer to expiration day, providing a headwind for VXX (a concept I previously outlined here).

Tomorrow a fragile Apple (AAPL) issues its dividend of $2.65, which will be deducted from its share price. It will be interesting to see if buyers step in to hold the price up.


. . . . . . . . . . . . . .

Stay up to date by having posts sent directly to your RSS feed or Email.

Just How Low Can VIX Go?

If you've been watching the markets lately and noticed that VIX has been spending some time in the 12s lately, you might be wondering just how much lower will VIX go?

Today's VIX close of 12.9 certainly sounds low but to put it in perspective let's take a look at the actual historical (realized) volatility of the S&P 500 over various time frames.

Historical Volatility (current)
Past two weeks (HV10):    6.85
Past Month (HV21):           6.20
Past 6 weeks (HV30):      11.55
Past 3 Months (HV63):    12.52
Past 6 Months (HV126):  11.49
Past Year (HV252):         12.84


Now let's take a look at the HV at a point in time 1 year ago:

Historical Volatility (as of 2/1/2012)
Past two weeks (HV10):     7.61
Past Month (HV21):            8.65
Past 6 weeks (HV30):       12.99
Past 3 Months (HV63):     21.22
Past 6 Months (HV126):   29.89
Past Year (HV252):          23.26

As you can see, the last year of trading has experienced much less volatility than the previous year. Note that the spot VIX on 2/1/2012 was 18.55, which fell in the range between HV30 and HV63 at the time. If you look at today's HV range you'll see that a VIX of 12.9  is priced at a reasonable point given the past year's levels of volatility.

Below is a graphical view of this progression of HV over the past year:

To give you one more interesting data point, let's take a look at the HV on 1/24/2007 when spot VIX closed at 9.89.

Historical Volatility (as of 1/24/2007)
Past two weeks (HV10):  6.68
Past Month (HV21):         6.82
Past 6 weeks (HV30):      6.34
Past 3 Months (HV63):    7.26
Past 6 Months (HV126):  7.35
Past Year (HV252):         9.69


So can VIX go lower? Absolutely - with another 30% to fall before reaching the 6-year low!

This is why it is critical to not assume that volatility will rise just because it is low relative to the recent past.  When trading volatility ETPs such as XIV, VXX, ZIV, and UVXY you always need to consider the shape of the VIX futures term structure and their values relative to VIX as well as historical volatility in order to make trading decisions.


. . . . . . . . . . . . . .

Stay up to date by having posts sent directly to your RSS feed or Email.

VIX Futures Weekly Wrap

VIX and VXX got a little perky during the week, perhaps signalling a move higher soon, but in the end the spot VIX (+0.08%) and VIX futures edged up only slightly from a week ago along all points on the curve. Here are the term structures:


Weekly scoreboard for VIX Futures ETPs and S&P 500:
- VXX: +0.61% 
- XIV:  -1.58%
- ZIV:  -1.10%
 
- SPX: +0.68% 

As of the close today all indicators for VIX trades are pretty well balanced, suggesting there aren't any multi-day trades in either direction that are likely to produce a profit with any high degree of certainty. There is still an ever-so-slight bias towards a long XIV position as mentioned yesterday but after today's large move I think it's better to wait for the next set up.


. . . . . . . . . . . . . .

Stay up to date by having posts sent directly to your RSS feed or Email.