Showing posts with label contango. Show all posts

Professional Volatility Strategies

Six years ago on this blog I wrote "XIV: When A "Sure Thing" Goes Bad, highlighting that the key drivers of Volatility ETPs are 1) the change in price of the relevant VIX futures contracts and 2) the term structure. While XIV no longer exists after last year's blow up, the message is still relevant to XIV's reduced leverage replacement, SVXY. In fact, an alternate title for this post could be "When a "Sure Thing" Goes Bad -- SVXY Edition"

Similar to XIV, SVXY is a fund that can be used as a play when an investor believes that volatility will decline. Although SVXY has only half the leverage that XIV had (-0.5x vs -1x), it can still produce strong gains and losses.

Below is a chart of the price of SVXY calculated as if it had the -0.5x leverage since 2004 (prices prior to the fund's official leverage reduction have been constructed by calculating the index value using 1st and 2nd month VIX futures data).


I've highlighted most of the larger price drops to help illustrate that SVXY is not a buy-and-hold security, even in its reduced leverage form. When the market structure changed in 2007 & 2008, SVXY still lost 70% of its value due to strong backwardation in VIX Futures.

As long-time readers know, the term structure of VIX futures is what drives various VIX funds, including SVXY, VXXB, UVXY, TVIX, VIXY, VIIX, and ZIV.

SVXY performs best in years where there is a strong and persistent contango, the condition where VIX is lower than VIX futures. The best way to measure the degree of contango for these products is to look at the weighted value of first and second month VIX futures as compared to spot VIX. Below is a graph of the weighted VIX futures values to spot VIX over the past 11 years.


The trendline here provides a way to filter out the daily noise and allows us to verify that the years in which SVXY performed the best experienced the largest and most persistent contango. On the flip side, the time frames that SVXY performed badly experienced backwardation and/or a small contango.

The fact that the term structure is such a strong driver of VIX ETPs is why professionals track this data closely. We track VIX Futures data and associated metrics shown on our website and use information from the term structure, price momentum, historical volatility, and the volatility of the VIX as inputs to our automated algorithms for buying and selling. The algorithm values are then used to trigger automated buying and selling of VIX ETPs and are emailed to subscribers. We track this data intraday as well and post it to both our Intraday Indicators page as well as our Daily Forecast page.

Our results (as tracked by a third party) substantially beat the S&P 500 over the long term. A screenshot of the VXX Bias and VRP+VXX Bias since we began tracking them on Collective2 are shown below:


VXX Bias:


VRP+VXX Bias ("Trading Volatility 1"):


Over the long term our approach can do well in both bull and bear markets, as seen in by our hypothetical backtest summary.


Clearly not all years are huge winners but the data shows that the use of the term structure data tends to be extremely valuable. If you are interested in checking out what we offer to subscribers you can view our Subscribe page.

One more note: We made a change to our VRP indicator in January 2019 so that it can now be used as a standalone strategy. As such, I am now having Collective2 track that as well. It can be found under Enhanced VRP.


------------
Hypothetical and Simulated Performance Disclaimer
The results are based on simulated or hypothetical performance results that have certain inherent limitations. Unlike the results shown in an actual performance record, these results do not represent actual trading. Also, because these trades have not actually been executed, these results may have under- or over-compensated for the impact, if any, of certain market factors, such as lack of liquidity. Simulated or hypothetical trading programs in general are also subject to the fact that they are designed with the benefit of hindsight. No representation is being made that any account will or is likely to achieve profits or losses similar to these being shown. Backtest results do not account for any costs associated with trade commissions or subscription costs.  Additional performance differences in backtests arise from the methodology of using the 4:00pm ET closing values for SVXY,  VXXB, and ZIV as approximated trade prices for indicators that require VIX and VIX futures to settle at 4:15pm ET.


. . . . . . . . . . . . . .

Stay up to date by having posts sent directly to your RSS feed or Email.

Have You Become Part of the Buy-and-Hold Equity Herd?

What is your investing game plan?

Has the S&P 500's longest bull market in history, with its 336% gain, finally converted you to become a part of the buy-and-hold equity herd?

Do you think the U.S. equity market is now immune from the carnage we've seen recently in Emerging Markets (MSCI Emerging Market Index is now off 20% from the January highs)? Have you cast aside the idea of a balanced investment portfolio?

You probably don't want to even think about it, but this bull market will not last forever.1 There will be an equity bear market here in the U.S. Non-diversified investors risk facing losses similar to that of the 2000 dot com bust and the 2008 financial crisis. The trap is that we don't know when. Any perma-bears left are still taking on losses, ineptly sitting in cash, or getting crushed by cryptocurrencies.

I personally like an aggressive Modern Portfolio Theory portfolio with a heavy weighting on equities -- but with one important modification. I like to carve out a small portion of my portfolio and allocate it to process-driven volatility trading which is long volatility at times and short volatility at other times.

This is the concept of including volatility as an asset and there are right and wrong ways to do it.

 - Wrong way #1: Buy-and hold a short volatility ETP.
XIV, which was the short volatility ETP of choice, suffered a catastrophic hit in February 2018 and investors lost hundreds of millions of dollars. Prior to going bust, XIV was the "can't lose" fund that returned over 10x since inception in 2010. Many people lost nearly all of their investment and various professional money managers were fired because they didn't know what they were doing and ignored the trouble signs of the underlying assets (VIX Futures). The calamity was so bad, that some brokers banned the purchase of short volatility ETPs to try to protect the average investor (a bit late for that, don't you think??).

- Wrong way #2: Buy-and-hold a long volatility ETP.
If buy-and-hold of the short side of volatility is wrong, then it must be better to buy-and-hold long volatility ETPs, such as VXX? No. VXX and the 2x leveraged UVXY & TVIX ETPs suffer long term decay thanks largely due to the fact that these funds track VIX Futures that are most often in a state of contango. Without getting technical, it should be sufficient to point out that VXX has gone from over $100,000 (adjusted for multiple reverse splits) to $27 over the course of its lifespan since inception 9 years ago.

- The Right Way #1: Our VRP+VXX Bias indicators.
Our volatility indicators put us in cash, long volatility, or short volatility based on daily measurements of various components within the volatility market in order to provides us with a "flexible" fifth asset (the others being equities, bonds, real estate, and commodities). To take diversification one step further, our volatility trading indicators are comprised of multiple unrelated component indicators. No single indicator is perfect and ours are no exception. When they don't agree on what to do we move our volatility allocation to cash (this by the way, is how we survived the February volatility market imploded).

One really nice aspect of our VRP+VXX Bias algorithms, in addition to being fully automated, is that they get us invested in an asset that is non-correlated with other assets. This is key to good diversification within a portfolio. Why? Because if you are diversifying using an asset that has high correlation to another invested asset, you are diversifying in name only while both assets carry roughly the same performance.

The flip side of the non-correlated asset coin, however, is the fact that there will be times when our indicators lag the market. 2018 has been pitiful so far and this can be frustrating if you are not looking at the big picture. And that is, a properly diversified and properly balanced portfolio will excel long term.

At any given time there will be a lagging asset within a diversified portfolio. Smart investors don't just scrap an asset class after a bad month/year -- they rebalance and focus on their process knowing that the next year is likely to result in an entirely different outcome. Otherwise, the investor is left with a portfolio that carries less diversification, greater risk, and a lower long-term return potential.


Our indicator's performance speaks for itself with actual automated signals and trades tracked by a third party since 2016, Collective2, here:


Looking further back using our modeling, we can see how VRP+VXX Bias ("Trading Volatility 1" performs in a variety of market conditions. By far, the best performing years for our indicators are when strong equity drawdowns occur, as can be seen in the chart below.


Trading Volatility+ subscribers have access to our VRP and VXX Bias indicators, our intraday indicator data, receive emails with preliminary and final change alerts for each of the indicators as well as our daily summaries, and interact with our private community of volatility traders in the forum. If interested, you can learn more about our services on our Subscribe page.

As always, each day's indicator values, buy/sell triggers, trade performance summary, and equity curves are tracked in the spreadsheets linked at the bottom of our Subscribe page. Additional information on our trading strategy and indicators can be found on our Strategy page.


Our indicators are also utilized by a volatility investment fund that is open only to accredited investors. If you think a managed volatility fund might better fit your needs please send a message through the Contact page.


Footnotes:
1 Smart people like to pretend they know why this bull market will end: the end of fiscal stimulus, rising interest rates, inflation, deflation, stagflation, global recession contagion, too much debt, high P/E ratios, trade wars, etc. No one knows the why or when and the average investor is unlikely to guess the when, and how it plays out, and be able to invest appropriately.

------------
Hypothetical and Simulated Performance Disclaimer
The results are based on simulated or hypothetical performance results that have certain inherent limitations. Unlike the results shown in an actual performance record, these results do not represent actual trading. Also, because these trades have not actually been executed, these results may have under- or over-compensated for the impact, if any, of certain market factors, such as lack of liquidity. Simulated or hypothetical trading programs in general are also subject to the fact that they are designed with the benefit of hindsight. No representation is being made that any account will or is likely to achieve profits or losses similar to these being shown. Hypothetical and backtest results do not account for any costs associated with trade commissions or subscription costs. Additional performance differences in backtests arise from the methodology of using the 4:00pm ET closing values for SVXY, VXX, and ZIV as approximated trade prices for indicators that require VIX and VIX futures to settle at 4:15pm ET


. . . . . . . . . . . . . .

Stay up to date by having posts sent directly to your RSS feed or Email.

VXX Bias Forecast Performance Review, 2014 Year-to-Date

With one third of 2014 now behind us, it's a good time to take a look at year-to-date performance of our Bias strategy. The U.S. stock market has been mixed so far this year (through May 9, 2014) with the S&P 500 index gaining 1.6%,  the Russell 2000 down 4.8%, and the NASDAQ 100 down 1%. The VIX has lost 5.8% YTD although it has seen some wild swings already, gaining 56.3% in early February before returning back to where it started.

At Trading Volatility we focus on trading of VIX ETPs with most attention on VXX and XIV. Today we'll review the year-to-date performance of the VXX Bias forecasts, which are generated after each trading day at 4:30pm ET.
- For those of you who are unfamiliar with our daily Bias forecasts more information can be found on the Daily Forecast page.
- For backtested performance of the Bias strategy dating back to 2006 please see this post.

VXX Bias Indicator Performance, 2014 YTD (Data sheet with trade and performance details)
As usual, we'll review the performance of the indicators in two halves:
1) the "Negative VXX Bias" strategy which involves buying XIV whenever the VXX Bias is negative, and
2) the "Positive VXX Bias" strategy which involves buying VXX whenever the VXX Bias is positive.

1) Negative VXX Bias Strategy
The VXX Bias forecasts are designed to help traders identify the direction and magnitude of any headwinds/tailwinds in VXX and XIV that arise from the structure and momentum of the underlying VIX futures securities. So far this year the Bias forecasts have identified a key change in market structure in early January to give traders a chance to exit positions in XIV before the full 29% drawdown (see graph below). Confident investors sparked a stock market rebound to keep that drawdown contained, but we've seen a mostly sideways/choppy market with a neutral VXX Bias for the majority of the year. Long-time readers of our posts will know that a neutral Bias makes for little or no trading edge in VIX ETPs, making for a more difficult trading environment. However, in late April & early May we've seen the VXX Bias grow more negative and exit the neutral zone to drive new lows in VXX and drive price higher in XIV.
- As of May 9, XIV has returned 0% YTD vs +3% with the Negative VXX Bias strategy.


2) Positive VXX Bias Strategy
We've seen several moves to a positive VXX Bias this year but only one instance has lasted more than a handful of days. In the January instance the VXX Bias remained positive for 13 days, with VXX gaining over 30% before finally closing out a 10.8% gain. Most of the remaining VXX trades have ended with small losses in typical VXX behavior. 2014 has once again demonstrated that while VXX can see good short-term gains, they tend to be fleeting when the Bias quickly returns to negative.


------------
Hypothetical and Simulated Performance Disclaimer
TThe results are based on simulated or hypothetical performance results that have certain inherent limitations. Unlike the results shown in an actual performance record, these results do not represent actual trading. Also, because these trades have not actually been executed, these results may have under- or over-compensated for the impact, if any, of certain market factors, such as lack of liquidity. Simulated or hypothetical trading programs in general are also subject to the fact that they are designed with the benefit of hindsight. No representation is being made that any account will or is likely to achieve profits or losses similar to these being shown. Additional performance differences in backtests arise from the methodology of using the 4:00pm ET closing values for XIV, VXX, and ZIV as an approximated trade prices for indicators that require VIX and VIX futures to settle at 4:15pm ET.


. . . . . . . . . . . . . .

Stay up to date by having posts sent directly to your RSS feed or Email.

Shorting Volatility: Time To Reduce Profit Expectations for 2014

With XIV down 7.6% so far this year after seeing 100%+ annual returns in both 2012 and 2013, many have been asking "Is the short volatility trade dead in 2014?" While my terse answer is "not necessarily," we need to take a closer look at the various aspects of the VIX futures market in order to gain some insight on where VIX ETFs could be headed.

The idea of reduced profit expectations for XIV is actually not new. Although XIV gained 107% in 2013, its gains have slowed to just +36% over the past 12 months. While we've talked about this several times last year (here and here and here), today we'll talk about why and take a look at the current outlook.


VIX Futures
The daily price movement of XIV/SVXY, VXX and UVXY/TVIX are determined by the price of the front two months of VIX futures. In the chart below you can see both front month (M1) and second month (M2) VIX futures over the past 12 months.


Current values of M1 (14.85) and M2 (15.75) are generally in the lower-middle portion of the range. We've seen these M1 & M2 price levels with a similar ~1 point spread before. In fact, M1 and M2 are essentially unchanged from 12 months ago and we've seen the same levels six other times during the past year (4/26, 7/29, 9/16, 10/30, 12/3, and 12/19). On all of these occasions we've seen M1 and M2 continue to fall, providing an average gain for XIV of 9% over the next 1-2 weeks. These gains tend to be short-lived as multi-day volatility spikes have resulted in 15%+ drawdowns in XIV for 5 of the 7 instances (exception were 10/30/13 and 12/3/13). This doesn't mean that the same thing will happen this time around, but it does provide some interesting data points.

We can see these moves reflected in the 1-year chart of XIV, below. While VIX futures are essentially unchanged over the past 12 months, monthly expiring futures and the roll yield continue to provide fuel for gains in XIV, which is +36% over the past 12 months (and VXX is -47%). There's no reason this dance can't continue at this "slower" rate as long as M1 and M2 remain range bound under 20, but periodic drawdowns are likely to continue resulting in choppy trading.


As a relevant side note, 3 month actual volatility in the S&P 500 (HV60) has risen about 1.3 points over the course of the past five months. This often serves as an approximate lower-bounds for VIX, as we can see in the HV-IV chart below (see green circles). This means VIX is less likely to soon push back down into the 11.9/12.3 range we saw late last year.


VXX Roll Yield
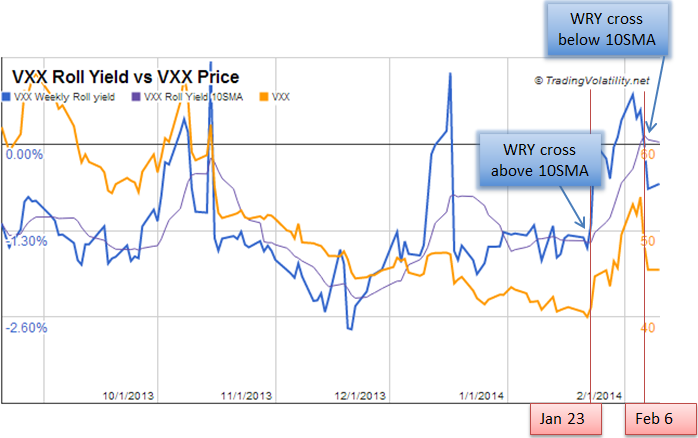
In addition to looking at the relative position of front month VIX futures, we need to also look at the headwind/tailwind for the securities that arises from the roll yield. The roll yield is proportional to the difference between the 1st and 2nd month VIX futures. Below I've charted VXX's weekly roll yield (WRY) over the past two years.


You can see how the roll yield for VXX has been much less negative so far this year, providing for less of a headwind for VXX and less of a tailwind for XIV/SVXY. In fact, so far this year the average VXX WRY has been just -0.7% (which is +0.7% for XIV). To put that number in context, below is a table of the average XIV weekly roll yield for each of the past 9 years.

XIV: Average Weekly Roll Yield vs. Annual Return
Year Avg WRY Annual Return
2005 1.6% 101%
2006 1.4% 14%
2007 0.6% -35%
2008 -0.6% -71%
2009 0.9% 118%
2010 2.1% 144%
2011 0.5% -46%
2012 2.1% 154%
2013 1.6% 107%
2014  0.7% -8% (YTD)


The 2014 average WRY is more or less in the middle of the range between the low (-0.6%) and high (+2.1%). So why is this important? Because the return of VIX ETFs is largely dependent on the roll yield. as illustrated by a scatter plot for the above table.


You can largely expect that the return of XIV 2014 will end up somewhere along this line. Think about this chart for another minute. Essentially the trendline is telling us that XIV needs an average WRY of at least 0.5% to have a chance at being positive for the year. Factor in a few 25%+ XIV drawdowns and realistically it needs an average WRY of 1% to really provide some confidence in the trade. With VIX futures already quite compressed along the entire term structure, that 1% WRY will be difficult to maintain unless M1 is able to spend much more time in the 13s. This would imply a VIX down in the 11-12 range -- quite a tall order at the moment.

Outliers on the graph above are the result of either a) major differences of the yearly starting and ending values of M1 (i.e. in 2009 M1 went from 45 to 20), or b) large multi-day volatility spikes that cause major (50%+) drawdowns in XIV (e.g. 2006, 2007, 2011) which are difficult to recover from based on the dynamics of percentages (i.e. it takes a 100% gain to fully recover from a 50% loss). For reference, below is a chart showing the value of front month VIX futures over the past 9 years (note that while M1 is low compared to the recent 5 years, it is still higher than most of 2005 and 2006).


VXX Forecast Review
As I turn to look at our daily VXX Bias Forecasts history, below, you can see why we identify the area between -1 and +1 as a "neutral zone" (highlighted in yellow) which is subject to a certain amount of thrash. These are are times when VXX generally moves sideways and is more susceptible to spikes. After looking at this forecast history it's not much of a surprise to learn that neither VXX (-1.7%) nor XIV (-7.6%) have gone anywhere this year.


Summarizing the current situation for XIV (and VXX/UVXY):
  • We've seen a narrow XIV weekly roll yield so far in 2014, but it has been increasing lately to the point where it is back above 1%. If XIV is going to continue to see gains the WRY needs to stay above this level. 
  • VIX futures are at the lower end of the range over the past few years. They've been at these levels and can continue lower, but their downside is more limited than the upside at this point, making for a pretty non-ideal time to aggressively short volatility. 
  • XIV has the potential to continue to rise as VIX futures roll forward each month. The next expiration date is April 16th.


. . . . . . . . . . . . . .

Stay up to date by having posts sent directly to your RSS feed or Email.

2014: Is It Still Profitable To Be Short VXX?

The markets are off to a bit of a rocky start to the year, particularly in the last couple of weeks. This is a distinct change of pace after a rather quiet end to 2013. VXX is +6.84% YTD after hitting a high of +30% on Wednesday. Will VXX see another year like 2012 and 2013 with losses of 60%? Or are we likely to see performance closer to 2011?

In this post I'll cover:
  • VIX Technical Review
  • Forecast Review
  • Trading Outlook
  • Trading Plan

VIX Technical Review 
VIX broke out above its 200SMA (14.4) on Jan 24 to start a rally that peaked at 21.48 seven days later. Since then it has quickly retreated and is approaching the 200SMA (now at 14.57) from the other direction. There are some other notable moving averages in the 14.4-14.9 area including the 100SMA, 50SMA, 60EMA, 90EMA and the lower envelope of the 10-2 Bollinger Band, as well as support levels established by previous VIX spikes. This suggests another 5% downside in VIX before support.


Taking a look at VIX futures (chart below), we went into backwardation for a day on Jan 24 and returned for six more days from Jan 30 through Feb 6. This was the longest string of backwardation we've seen since the the Aug 2011 selloff. The impact that backwardation and rising VIX futures have on the price movement of VIX ETF was made clear as XIV fell 30% from its Jan 22 close to its Feb 5 low. Although XIV has recovered somewhat and is down "only" 17% from Jan 22, it is still at risk for further declines should we see a move back to backwardation (also see "XIV: When a 'Sure Thing' Goes Bad").

This was a relatively mild volatility spike with VIX reaching just beyond its long term average of 19.8. Should this move in VIX continue to be more than just a blip on the radar, XIV could see some major losses. We're now back in a slight contango after Friday with Feb at 15.47 and March at 15.88. Feb VIX futures are 1% above spot VIX, which is a very small premium with six trading days left before Feb VIX futures expire. Typically you can expect VIX and expiring VIX futures to remain pretty well coupled as we approach expiration.


Forecast Review
With the expectation for a more dynamic market in 2014, we've been using the signals from our WRY-10SMA indicator in addition to our Bias forecasting signals to guide us in trading. This provides us with additional signals to help avoid short-term drawdowns. After a choppy and sideways January we saw a move in the VXX Weekly Roll Yield above its 10SMA on January 23rd. Combining this with a confirming MACD signal in the VIX on that same day, we went long VXX, selling a potion on the 24th and the remainder on the 27th to lock in 11% gains. This turned out to be premature as the WRY stayed above its 10SMA for 7 more days and an additional 19% gain in VXX, but I find it's always good to take profits in VXX before they disappear. (Note: we will soon be updating our WRY-10SMA indicator to reduce the amount of signal noise by utilizing exponential moving averages.)


Looking at our Bias forecast over the past six months, the negative bias on VXX has been trending smaller resulting in a more difficult short of VXX.


Our VXX Spike Risk forecasts showed a substantially elevated risk over the last few of weeks rising from 25% up to 70%.


Trading Outlook 
First and foremost, let's respect the fact that the market is moving higher, the VXX bias is back to negative, and the VXX WRY is below its 10SMA. Follow this trend and see how we do with the various levels of resistance in the S&P 500 next week (1810 and 1820). Let's also respect the fact that XIV dropped 30% on a modest 5% pullback of the S&P. We are in a relatively old bull market which is rather complacent and investors are heavily leveraged while shorting volatility is a crowded market. We don't yet know if the emerging market issues from the past 2 weeks were just noise or the start of a real problem. When we hit a real problem somewhere down the line VIX will spike quickly and severely and I, for one, don't want to be heavy on the wrong side of the trade when it does.


Trading Plan
Please login to the Members' Forum to finish reading this article. If you're not yet a member you can join via the Subscribe page.


. . . . . . . . . . . . . .

Stay up to date by having posts sent directly to your RSS feed or Email.

Watching For The Return Of Volatility

Hello and welcome back! I hope everyone had a great Thanksgiving break.

Today I wanted to provide a brief look back on volatility over the past several weeks and provide my thoughts on what it means going forward. Ever since the debt ceiling deadlock concluded in October, VIX has remained in a fairly tight range between 12 and 14. Meanwhile, the S&P 500 has notched eight straight weeks of gains.

In this post I'll be covering:
  • Technical Review
  • Forecast Review
  • Nov 15 VIX Reversal
  • Elevated SKEW
  • Trading Plan (Member Access Only)


Technical Review
Taking a look at the chart of implied volatility vs actual volatility (from the VIX Futures Data page), we can see that the current VIX range is roughly the same as what we saw in the July/August timeframe (orange highlight), which at the time, bounced along the floor set by HV60 (actual volatility over the last 60 trading days). Actual volatility in the S&P 500 has continued to decline since then and the HV60 floor is now two points lower, hitting 10.28 on Friday. This premium in VIX to HV60 tells us that options sellers are not yet convinced that the low volatility environment we are currently experiencing will continue into 2014.


The VIX futures term structure shows us a pretty consistent contango since mid October, with nearer months cheaper than the more distant months. Overall the movement has been mostly sideways with a slight decline across all months, while the front months futures have fallen more rapidly toward spot VIX.


Forecast Review
Looking at our forecast charts we can see that the Bias (left axis) has remained mostly negative for VXX and positive for ZIV. During this past 6 months VXX has declined from $80 to $45 (-43%), while VXX inverses (XIV and SVXY) have each gained 45%. Meanwhile, ZIV has increased 18%, moving from $30 to $35.80.


Taking a look at the VXX Spike Risk forecast we can really get a feel for how sleepy the volatility market has been lately with only a couple days above the 30% risk mark over the past 6 weeks.


Nov 15 VIX Reversal
On Nov 20th I posted in our Members' Forum about a possible reversal in the VIX daily chart that occurred on Nov 15th. While it is still possible to break lower, this remains something for VIX traders to watch in the coming weeks, especially as we press up against the 200 day moving average at 14.37 (red dashed line).


Elevated SKEW
The CBOE SKEW index has been elevated near 130 for a few weeks now (weekly chart below) and is at its highest levels since March 2012. This value tells us that the options market views a higher probability of returns that are two or more standard deviations below the mean over the next 30 days, which represents a 15%+ decline in the S&P 500. Given the recent run-up in stocks an expectation of a pullback isn't too surprising, but is something to be prepared for nonetheless.


Trading Plan (Member Access Only)
Please login to the Members' Forum to finish reading this article. If you're not yet a member you can join via the Subscribe page.


. . . . . . . . . . . . . .

Stay up to date by having posts sent directly to your RSS feed or Email.

Volatility Trading Outlook With The S&P 500 At All Time Highs

With the debt ceiling drama behind us the S&P has responded by making new all-time highs, while the VIX has fallen back to levels from Sept 20 and are VIX futures are back in a moderate contango. From the VIX Futures Data page:


Since Oct 18, VIX and VIX futures have been essentially frozen with intraday ranges of only a couple points for VIX and a range of closing values of just 0.38 points. The fact that VIX futures across all months are not declining, but flat (and ever so slightly up in months 3-7), is indication that all may not be well -- especially as the S&P is hitting all time highs. Usually when we see the VIX term structure hold steady like this investors are starting to pick up on some sort of risk on the horizon (see May 10th - 21st), however, no risk seems to be readily apparent at the moment (although I can name several that are on my mind). Maybe this is just a period of consolidation after a swift move down, but it doesn't quite sit right with me.

It is a five week roll period this month, with 17 trading days still left until November futures expire on Nov 20. Assuming we manage to avoid unforeseen drama during this time we should expect Nov futures to converge towards VIX (Nov currently at a 11% premium to VIX), and VIX to fall along with HV20 towards HV60. This will cause VXX to drift lower and SVXY higher, however the entire futures curve is once again rather compressed with limited room to the downside and larger risk to the upside. I see a ceiling for XIV over the next few weeks in the $32-33 area (~$125 for SVXY). For ZIV, $36 looks to be the limit.


With people increasingly predicting new highs and getting greedy I start to get concerned and like to raise cash. No one really knows if we'll go on like this for months or if the rally ends tomorrow, but all good things come to end so it's always good to take profits along the way and raise stops to help manage risk.


. . . . . . . . . . . . . .

Stay up to date by having posts sent directly to your RSS feed or Email.

Looking Ahead At VIX & VIX Futures Near All-Time Market Highs

The stock market has been rallying in full force over the past month with the S&P 500 up 7.2% since it put in its low on 6/24.

VIX has fallen 34.5% since that date with VIX futures following suit across the board (see chart below), driving VIX-related ETPs accordingly:


  • XIV:  +40.7%
  • ZIV:  +16.6%
  • VXX: -30.0%
  • UVXY: -52%


  • Our Daily Forecasts have performed well over this time, with the VXX bias shifting from positive back to negative on the evening of 6/21...


    ...and the VXX Spike risk dropping back below the danger zone (60%) on the evening of 6/25 and staying there ever since.


    Actual historical volatility of the S&P 500 has started coming into play to hold the VIX up a bit. HV60, the actual volatility over the past 3 months (60 trading days), is serving as a floor to the VIX, as can be seen in the chart below.


    For trading of VIX ETPs over the coming weeks what's important to note is...

    Continue reading this post on the Members' Forum

    If you are not yet a member you can Subscribe for access to Trading Volatility+.


    . . . . . . . . . . . . . .

    Stay up to date by having posts sent directly to your RSS feed or Email.

    VIX Nears A Floor After A Week Of Heavy VIX Selling

    VIX took a holiday as well this week falling 11.9% from last Friday's close. The VIX Futures term structure contango steepened as all months along the curve fell in proportion to VIX. Here's the week over week change in term structure:


    From our daily forecasts we can see that after a month of elevated spike risk, the VXX Spike Risk forecast fell below the 5.0 "danger zone" on the evening of June 26th and remained there this week, with VXX losing 12% since that time (and XIV +13.3%).


    Spot VIX is starting to press down towards the VIX "floor" set by actual market volatility over the past 3 months (HV60), with VIX now just 5% higher than HV60. We could still see VIX press down into the 13s, but I don't expect it to head much lower (see green circles below).


    UPDATED 7/8: Corrected week-over-week term structure chart and VIX % change


    . . . . . . . . . . . . . .

    Stay up to date by having posts sent directly to your RSS feed or Email.

    VXX Continues To Drive Upward

    VIX and VXX continued their upward trend today with the VIX futures term structure flattening substantially, making it impossible for XIV and ZIV to make any upward progress.

    We've been playing in the danger zone ever since the VXX Spike Risk gauge from our Daily Forecasts moved above 5.0 on 5/28, with VXX +16% since then. The flattening of the term structure today marks another possible shift in sentiment and puts the curve at risk of flipping to backwardation.

    We're at a point where it is critical that...

    Continue reading this post on the Members' Forum

    If you are not yet a member you can Subscribe for access to Trading Volatility+.


    . . . . . . . . . . . . . .

    Stay up to date by having posts sent directly to your RSS feed or Email.

    VIX Futures Flash Warning Signs

    Some negative developments in the VIX futures term structure occurred today with a flattening of the term structure (see full current term structure data here):
     - Spread between M1 and M2 narrowed to -0.75
     - Spread between M4 and M7 narrowed to -1.15
     - Spread from M1 to M7 narrowed to just -3.15 points

    The roll yields for XIV and ZIV fell to 1.1% and 1.5%, respectively.

    To put the M1-M7 spread in context here is a view of the slope of the VIX futures (left axis) along with the price on XIV (right axis). A slope reading below 0.2 has typically been market negative in the very short term over the past few years (today's closing was 0.19).


    The rise in VIX to 14.49 (+7.2%) brings it to within 5% of front month futures and increases the risk of a larger VXX spike in the short term. The volatility risk premium remains negative, with actual volatility over the past month (HV21) at 14.77.

    The VXX forecast VXX spike gauge reflects these changes with a reading of 5.8. When the reading on here is above ~5.5 you can generally expect some choppiness in the price of XIV & VXX as a best case, and worst case of some large VXX moves upward.


    Because of these current conditions and a multitude of warning signals I'm still not interested in a XIV long position. As I've suggested in the past week herehere, and here it makes sense to look into some cheap VXX calls as a hedge if I were long XIV/SVXY or be out altogether.


    . . . . . . . . . . . . . .

    Stay up to date by having posts sent directly to your RSS feed or Email.

    The #1 Rule For Trading Volatility ETFs

    Every couple weeks or so I see a new article from someone giving advice on how to trade volatility ETFs & ETNs such as XIV, VXX, SVXU, UVXY, and ZIV. Often the author will at least know that these products trade based on the VIX futures. But every once in awhile I'll see something more misguided, like the chart below. While it looks promising, once it is applied to historical data it does not deliver positive results.


    For example, let's take a look at the period between August 2004 and May 2006 when VIX bounced between 10 and 16 (VIX on left axis; VXX on right axis). The chart says buy VXX below a VIX of 16.


    The return for VXX during this time was -75%, a loss attributed to the fact that the front two months were in contango with a spread averaging 0.98.

    Let's continue on to the next period, between May 2006 and Feb 2007 when VIX was spending much of its time between 10 and 12.  The result for VXX is a 57% loss, and again the reason is a contango term structure, with an average spread between front month futures (M1) and 2nd month futures (M2) of 0.85.


    You may point out the spike in VXX from $1000 to $1350 on the left hand of the chart, which is a nice 35% gain. Unfortunately, if you were following the chart and buying XIV when VIX rose above 16 then you would have lost 30% over the next couple of weeks before almost breaking even if you held your position until VIX dropped below 16 again.

    OK, so I can hear some of you saying that I'm cutting off the chart before VIX and VXX spikes. Take a look at the next period, from Feb 2007 to Feb 2011 when VIX spiked during the 2008 crash. During this time VIX was above 16. Since the chart above says buy XIV when VIX is above 16, I'll compare VIX (left axis) to the price of XIV (right axis).


    The result is a 64% loss up until Dec 2007, followed by another 66% loss from Aug 2008 to Dec 2008, for a total of an 88% loss in XIV from 2/27/07 to 12/19/08.  At this point your position has essentially been demolished after this 21 month period. But let's give you the benefit of the doubt and say that you stayed solvent and held on to this position for the 4 year period until VIX dropped below 16 again. In that case you managed to almost break even in that XIV trade.

    Looking at the term structure during this period, we find that between 2/27/07 and the bottom in 12/19/08 the term structure was in backwardation, with an average of a 0.67 spread between the first two months. Backwardation has the effect of making VXX rise and XIV fall.

    From 12/20/08 to 3/24/2011, when the price in XIV goes up from 2 to 14 for an excellent 7x return, the term structure is back in contango with an average of 1.51 points between M1 and M2. Contango has the effect of making XIV rise and VXX fall.

    At this point, the #1 rule in trading volatility-based ETFs should be clear: Follow The Term Structure.

    The term structure is going to be the biggest driver of price for volatility-based ETPs over time. There are of course other factors that need to be taken into account when trading volatility ETPs in order to maximize your gains, but you will be able to trade these products pretty well just by following this rule.

    To view the current term structure and other metrics that are critical to trading volatility ETPs, visit the VIX Futures Data page.


    **Note: VXX and XIV price data prior to the funds' first trading days (1/30/2009 for VXX and 11/30/2011 for XIV) have been calculated by using the VIX short-term futures underlying index values derived from actual data of month 1 and month 2 futures.


    . . . . . . . . . . . . . .

    Stay up to date by having posts sent directly to your RSS feed or Email.

    Daily Wrap and VXX Forecast For 4/18

    In yesterday's post I noted that the risk of a spike in VXX was quite elevated, with the needle on the VXX Spike Risk gauge approaching the red zone. Today VXX closed at 21.07 after a moderate/strong gain of +11.5%.

    The term structure flattened out a bit but is still in a slight contango, producing nearly irrelevant roll yields for XIV and ZIV of +0.5% and +1.65%, respectively.


    Spot VIX closed 0.1 above front month VIX futures at 16.51, making a short of VXX very risky. Given the 18% spike in VIX today there is a good probability that it will retrace some of those gains tomorrow but by no means does it have to, and a spike today does not rule out the possibility of another spike tomorrow. Generally these are the types of situations where I prefer to wait for a setup that is more predictable.

    The VXX forecast for tomorrow (preview below) generally reflects a neutral bias and a reduced, but still elevated, risk of a VXX spike.


    . . . . . . . . . . . . . .

    Stay up to date by having posts sent directly to your RSS feed or Email.

    Daily Wrap, April VIX Expiration, and VXX Forecast for 4/17

    The term structure reverted back to a (slight) contango today with April and May separated by 0.8 points, as seen in the term structure from the VIX Futures Data page.


    Since VIX futures roll tomorrow morning I care more about the May and June futures, which are separated by 0.95 points.  This will set up to be a good chance to buy XIV if the market can find any foothold tomorrow. One problem with the trade, however, is that VIX is not really overpriced here. Historical (actual) volatility over the past month is now 13.47, with VIX just 3.7% higher, as shown in the HV vs IV chart:


    Sellers of options want to collect a premium that is reflective of historical conditions and future risks and it remains to be seen if traders think that the action in the past couple days was just a fluke. If we can get some calm days in the market, both VIX and HV21 will drift lower, possibly as low as actual volatility over the past 3 months (HV63) which is currently around 11.0 -- ~20% lower than where VIX is currently.

    The other risk to the trade is that May futures aren't really overpriced either. At 14.75, May VIX futures are just 5.6% above spot VIX, meaning there is not much buffer to absorb a spike in VIX, making a sharp drop in XIV very possible if the market sees more selling.

    In addition to the roll yield of about 1.4% per week on XIV, another positive data point for the trade is that the market is down 1.2% over the past three days while VIX is up 14%. This suggests that the move in VIX may have been overdone, especially if you think the market has already priced in risk from what has happened over the past few days..

    Taking a look at the the VXX Forecast for tomorrow (preview), we can see that the roll yield and risk of a VXX spike reflect the numbers discussed above.


    . . . . . . . . . . . . . .

    Stay up to date by having posts sent directly to your RSS feed or Email.

    XIV: When A "Sure Thing" Goes Bad

    A shift occurred in the market today with 1st and 2nd month VIX futures closing in a very slight backwardation of 0.05 points, with April at 16.65 and May at 16.60 (see data page). While this does not necessarily mean a continued selloff in XIV, I think it is very important for anyone who has grown accustomed to the seemingly unidirectional movement in XIV to understand that gains are not always a given.

    We've seen a good run -- the result of a VIX that has declined from 26.66 on 6/1/12 down to six-year lows of 11.03 in March, as well as rolling futures in a contango term structure.  The result has been a staggering 200% gain over the past 9 months, and a 400% gain since 11/21/2011. It seems that money has been raining from the skies!

    But remember that key drivers of VIX futures ETFs are 1) change in price of the relevant VIX futures contracts and 2) the term structure. Today we saw a shift in the flattening of the term structure which should signal a very loud "caution" to you.

    When it comes to trading VIX futures ETPs it is critical to watch  for these changes in market structure.  Consider the following graph of XIV from 2004 through 2013 (prices prior to the fund launch have been by calculating the index value using 1st and 2nd month VIX futures data).


    Those are some seriously painful losses! The thing that all of those declines have in common is a term structure shifting into backwardation. This is why it is so important to watch the term structure -- something that I watch daily by looking at the VIX Futures Data page (see 'M1-M2' for XIV and 'M4-M7' for ZIV) or the Daily Forecast (see the 'VXX Bias' gauge).

    Exiting long XIV positions when the term structure flattens before a move to backwardation, can help you avoid these losses.


    Today's closing term structure:


    Tomorrow's VXX forecast: no bias from roll yield.  Spike risk remains elevated.:


    . . . . . . . . . . . . . .

    Stay up to date by having posts sent directly to your RSS feed or Email.