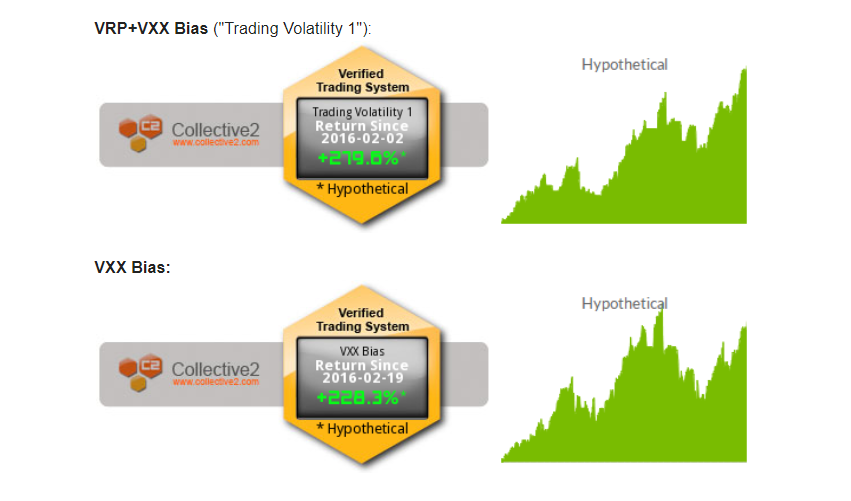
Here is the performance of our indicators in 2020, through March 18th, as tracked by a third party (Collective2):
- VRP+VXX Bias: +170%

- VXX Bias: +238%

Subscribers to these blog posts have known since last September that something like this was coming, as I outlined in "The Once-A-Decade Volatility Trade" post. In that article I wrote
"Your opportunity is to join us now because once the next volatility spike it's too late. Our gains will be made and those without hedges in place will have lost. It's that simple."
I'm sorry to say that it is now too late for non-subscribers to capture the full extent of this move.
However, there is still an opportunity to capture additional gains on upside from a long volatility trade (via VXX, UVXY, or TVIX) as well as "The Once-A-Decade Short Volatility Trade" which will happen after this current volatility spike runs its course.
In fact, as I've previously written in my Market Crash Protection post, our indicators successfully identify times when the market is strong and it is appropriate to short VXX (or buy an inverse ETF such as SVXY or the much-anticipated SVIX). The short volatility side of the trade is historically where most of our gains come from.
2020 has been a big year on the long volatility side of the trade and I expect it to be just as big on the short volatility side of the trade as we make our way through the Coronavirus (COVID-19) crisis.
These are difficult times and I believe that our automated trading process can be an enormous benefit to anyone who wants to be able to filter out the noise and emotional pitfalls of trading in this market.
As you know, I was not exaggerating when I said we will have the "Once A Decade Volatility Trade" and I am not exaggerating when I say we will have "The Once A Decade Short Volatility Trade."
Join us as a Trading Volatility+ subscriber so this next opportunity doesn't pass you up.
You can view what we offer to subscribers at our Subscribe page. Considering the information you get from our service, our subscription prices are actually ridiculously cheap. And for those who are afraid of commitment, we offer day passes with full access to our site for as little as $4/day.
To learn more visit our Strategy page. You can also view all the trades that our strategies have generated over the years by looking at the spreadsheets on the Results page or links to Collective2. We strive to be as transparent as possible with our service.
To learn more visit our Strategy page. You can also view all the trades that our strategies have generated over the years by looking at the spreadsheets on the Results page or links to Collective2. We strive to be as transparent as possible with our service.
Free E-book:
If you'd like to learn more about our how volatility ETFs work you can read our free e-book, Fundamental Concepts and Strategies for Trading Volatility ETPs, which is available for free download. If you are curious about how our Bias forecasts work and why they have been successful in identifying long-term trends under a variety of market conditions, be sure to give this a read. It explains the basic concepts of VIX and VIX futures as well as the main price drivers of various volatility ETPs, including the popular funds VXX, VIXY, SVXY, UVXY, ZIV, and VXZ. I believe that the concepts outlined in the e-book are critical to understand if you're going to trade these products.
------------
Hypothetical and Simulated Performance DisclaimerThe results are based on simulated or hypothetical performance results that have certain inherent limitations. Unlike the results shown in an actual performance record, these results do not represent actual trading. Also, because these trades have not actually been executed, these results may have under- or over-compensated for the impact, if any, of certain market factors, such as lack of liquidity. Simulated or hypothetical trading programs in general are also subject to the fact that they are designed with the benefit of hindsight. No representation is being made that any account will or is likely to achieve profits or losses similar to these being shown. Hypothetical and backtest results do not account for any costs associated with trade commissions or subscription costs. Additional performance differences in backtests arise from the methodology of using the 4:00pm ET closing values for SVXY, VXX, and ZIV as approximated trade prices for indicators that require VIX and VIX futures to settle at 4:15pm ET
Hypothetical and Simulated Performance DisclaimerThe results are based on simulated or hypothetical performance results that have certain inherent limitations. Unlike the results shown in an actual performance record, these results do not represent actual trading. Also, because these trades have not actually been executed, these results may have under- or over-compensated for the impact, if any, of certain market factors, such as lack of liquidity. Simulated or hypothetical trading programs in general are also subject to the fact that they are designed with the benefit of hindsight. No representation is being made that any account will or is likely to achieve profits or losses similar to these being shown. Hypothetical and backtest results do not account for any costs associated with trade commissions or subscription costs. Additional performance differences in backtests arise from the methodology of using the 4:00pm ET closing values for SVXY, VXX, and ZIV as approximated trade prices for indicators that require VIX and VIX futures to settle at 4:15pm ET