Showing posts with label VIX futures. Show all posts

Professional Volatility Strategies

Six years ago on this blog I wrote "XIV: When A "Sure Thing" Goes Bad, highlighting that the key drivers of Volatility ETPs are 1) the change in price of the relevant VIX futures contracts and 2) the term structure. While XIV no longer exists after last year's blow up, the message is still relevant to XIV's reduced leverage replacement, SVXY. In fact, an alternate title for this post could be "When a "Sure Thing" Goes Bad -- SVXY Edition"

Similar to XIV, SVXY is a fund that can be used as a play when an investor believes that volatility will decline. Although SVXY has only half the leverage that XIV had (-0.5x vs -1x), it can still produce strong gains and losses.

Below is a chart of the price of SVXY calculated as if it had the -0.5x leverage since 2004 (prices prior to the fund's official leverage reduction have been constructed by calculating the index value using 1st and 2nd month VIX futures data).


I've highlighted most of the larger price drops to help illustrate that SVXY is not a buy-and-hold security, even in its reduced leverage form. When the market structure changed in 2007 & 2008, SVXY still lost 70% of its value due to strong backwardation in VIX Futures.

As long-time readers know, the term structure of VIX futures is what drives various VIX funds, including SVXY, VXXB, UVXY, TVIX, VIXY, VIIX, and ZIV.

SVXY performs best in years where there is a strong and persistent contango, the condition where VIX is lower than VIX futures. The best way to measure the degree of contango for these products is to look at the weighted value of first and second month VIX futures as compared to spot VIX. Below is a graph of the weighted VIX futures values to spot VIX over the past 11 years.


The trendline here provides a way to filter out the daily noise and allows us to verify that the years in which SVXY performed the best experienced the largest and most persistent contango. On the flip side, the time frames that SVXY performed badly experienced backwardation and/or a small contango.

The fact that the term structure is such a strong driver of VIX ETPs is why professionals track this data closely. We track VIX Futures data and associated metrics shown on our website and use information from the term structure, price momentum, historical volatility, and the volatility of the VIX as inputs to our automated algorithms for buying and selling. The algorithm values are then used to trigger automated buying and selling of VIX ETPs and are emailed to subscribers. We track this data intraday as well and post it to both our Intraday Indicators page as well as our Daily Forecast page.

Our results (as tracked by a third party) substantially beat the S&P 500 over the long term. A screenshot of the VXX Bias and VRP+VXX Bias since we began tracking them on Collective2 are shown below:


VXX Bias:


VRP+VXX Bias ("Trading Volatility 1"):


Over the long term our approach can do well in both bull and bear markets, as seen in by our hypothetical backtest summary.


Clearly not all years are huge winners but the data shows that the use of the term structure data tends to be extremely valuable. If you are interested in checking out what we offer to subscribers you can view our Subscribe page.

One more note: We made a change to our VRP indicator in January 2019 so that it can now be used as a standalone strategy. As such, I am now having Collective2 track that as well. It can be found under Enhanced VRP.


------------
Hypothetical and Simulated Performance Disclaimer
The results are based on simulated or hypothetical performance results that have certain inherent limitations. Unlike the results shown in an actual performance record, these results do not represent actual trading. Also, because these trades have not actually been executed, these results may have under- or over-compensated for the impact, if any, of certain market factors, such as lack of liquidity. Simulated or hypothetical trading programs in general are also subject to the fact that they are designed with the benefit of hindsight. No representation is being made that any account will or is likely to achieve profits or losses similar to these being shown. Backtest results do not account for any costs associated with trade commissions or subscription costs.  Additional performance differences in backtests arise from the methodology of using the 4:00pm ET closing values for SVXY,  VXXB, and ZIV as approximated trade prices for indicators that require VIX and VIX futures to settle at 4:15pm ET.


. . . . . . . . . . . . . .

Stay up to date by having posts sent directly to your RSS feed or Email.

2016 VIX Futures Expiration Days And Roll Period Lengths

In preparation for trading VIX ETPs in 2016, I wanted to share the expiration date for all monthly VIX futures next year as well as the number of days in each roll period. Table below (source calendar).

Expiration Date           Roll Period Length
- Ending January 20:          23 days
- Ending February 17:        19 days
- Ending March 16:           20 days
- Ending April 20:              24 days
- Ending May 18:              20 days
- Ending June 15:              19 days
- Ending July 20:               24 days
- Ending August 17:           20 days
- Ending September 21:     19 days
- Ending October 19:         20 days
- Ending November 16:      20 days
- Ending December 21:      24 days


. . . . . . . . . . . . . .

Stay up to date by having posts sent directly to your RSS feed or Email.

Our Indicator Performance: +71% YTD Through May

Inverse volatility ETFs continued their uptrend in May with XIV adding 13.4% during the month, bringing its year-to-date gains up to +45%. Here's a look at XIV's YTD chart:


A 45% gain in the first five months of the year is pretty good, but our indicators are all outperforming the buy-and-hold approach. Here is the performance of our indicators in 2015, through May 29th:
-  VXX Bias:             +69%
-  VRP:                    +60%
-  VRP+VXX Bias:     +71%

The equity curve for each strategy with comparison to XIV is shown in the following graph (the S&P 500 is +2.4% YTD and is not shown):


Trade statistics for each strategy are summarized as follows:


If you're not quite meeting your investment objectives this year perhaps we can help. For less than $3 per day we provide subscribers access to all of our VIX data & metrics, our indicators, automated change alerts, and the members' forum.

For those interested in additional detail, the daily history of indicator values that have been emailed to subscribers in 2015 can be found in the data sheet links below:
- VXX Bias: 2015
- VRP: 2015
- VRP+VXX Bias: 2015


______
Hypothetical and Simulated Performance Disclaimer
The results are based on simulated or hypothetical performance results that have certain inherent limitations. Unlike the results shown in an actual performance record, these results do not represent actual trading. Also, because these trades have not actually been executed, these results may have under- or over-compensated for the impact, if any, of certain market factors, such as lack of liquidity. Simulated or hypothetical trading programs in general are also subject to the fact that they are designed with the benefit of hindsight. No representation is being made that any account will or is likely to achieve profits or losses similar to these being shown. Additional performance differences in backtests arise from the methodology of using the 4:00pm ET closing values for XIV, VXX, and ZIV as approximated trade prices for indicators that require VIX and VIX futures to settle at 4:15pm ET.


. . . . . . . . . . . . . .

Stay up to date by having posts sent directly to your RSS feed or Email.

Our Indicator Performance +56% YTD Through April

April was a great month for inverse volatility ETFs and XIV in particular as it gained nearly 16% over the month to settle at +29% YTD. The trend was generally strong and without drama this month although it did give back some gains in the last week. XIV's one-month chart:


Our daily indicators rode this wave of gains throughout the month on only one trade, with the VXX Bias generating an XIV buy signal on 3-20-15 and our VRP indicator signalling a buy for XIV on 4-1-15.

This month's gains added to already impressive year-to-date returns for our indicators. Indicator performance through April:
-  VXX Bias: +51%,
-  VRP: +48%
-  VRP+VXX Bias: 56%.

The equity curves for each strategy with comparison to XIV are shown in the following graph (the S&P 500 is +1.4% YTD and is not shown):


Trade statistics for each strategy are summarized as follows:


For those interested in additional detail, the daily history of indicator values that have been emailed to subscribers in 2015 can be found in the data sheet links below:
- VXX Bias: 2015
- VRP: 2015
- VRP+VXX Bias: 2015


______
Hypothetical and Simulated Performance Disclaimer
The results are based on simulated or hypothetical performance results that have certain inherent limitations. Unlike the results shown in an actual performance record, these results do not represent actual trading. Also, because these trades have not actually been executed, these results may have under- or over-compensated for the impact, if any, of certain market factors, such as lack of liquidity. Simulated or hypothetical trading programs in general are also subject to the fact that they are designed with the benefit of hindsight. No representation is being made that any account will or is likely to achieve profits or losses similar to these being shown. Additional performance differences in backtests arise from the methodology of using the 4:00pm ET closing values for XIV, VXX, and ZIV as approximated trade prices for indicators that require VIX and VIX futures to settle at 4:15pm ET.


. . . . . . . . . . . . . .

Stay up to date by having posts sent directly to your RSS feed or Email.

Our VRP+VXX Bias Indicator +35% in 1st Quarter

The first quarter of 2015 has come to a close and investors everywhere are reviewing their performance. This is the perfect time to evaluate the effectiveness of your investment strategies and to make adjustments accordingly.

Our VXX Bias and VRP indicators have both navigated the first quarter quite well, at +31% and +29% YTD, respectively. These two indicators each provide end-of-day signals for placing swing trades in XIV and VXX (if you're not already familiar with our trading strategies you can learn more about them here). 

Our preferred strategy, VRP + VXX Bias, combines the two signals to place trades only when they agree on direction and is +35% YTD.

The graph below tracks the daily values for each of our indicators as well as XIV (buy-and-hold) as a comparison reference point (the usual investment benchmark, the S&P 500, is not included because it is an irrelevant +0.9% YTD).


We kept commission fees low by placing only a half dozen trades in the first quarter. Trade statistics for each strategy are summarized as follows**:


If you're not quite meeting your investment objectives this year perhaps we can help. For less than $3 per day we provide subscribers access to all of our VIX data & metrics, our indicators, automated Bias change alerts, and the members' forum.


--> New in 2015, we will be providing an additional level of visibility into our trading by having our performance verified by a third party (Marketfy). We recently tweeted our YTD portfolio performance of +17.8%, which was obtained by using the VRP+VXX Bias strategy as our guide. Look for additional updates on real-time notifications of our trades in the future.


**For those interested in additional detail, the daily history of indicator values that have been emailed to subscribers in 2015 can be found in the data sheet links below:
- VXX Bias: 2015
- VRP: 2015
- VRP+VXX Bias: 2015

______
Hypothetical and Simulated Performance Disclaimer
The results are based on simulated or hypothetical performance results that have certain inherent limitations. Unlike the results shown in an actual performance record, these results do not represent actual trading. Also, because these trades have not actually been executed, these results may have under- or over-compensated for the impact, if any, of certain market factors, such as lack of liquidity. Simulated or hypothetical trading programs in general are also subject to the fact that they are designed with the benefit of hindsight. No representation is being made that any account will or is likely to achieve profits or losses similar to these being shown. Additional performance differences in backtests arise from the methodology of using the 4:00pm ET closing values for XIV, VXX, and ZIV as approximated trade prices for indicators that require VIX and VIX futures to settle at 4:15pm ET.


. . . . . . . . . . . . . .

Stay up to date by having posts sent directly to your RSS feed or Email.

2015 VIX Futures Expiration Days And Roll Period Lengths

As we get ready to head into 2015, I wanted to share the expiration date for each VIX futures month next year as well as the number of days in each roll period. Table below (source calendar).

Expiration Date           Roll Period Length
- Ending January 21:          22 days
- Ending February 18:        19 days
- Ending March 18:           20 days
- Ending April 15:              19 days
- Ending May 20:              25 days
- Ending June 17:              19 days
- Ending July 22:               24 days
- Ending August 19:           20 days
- Ending September 16:     19 days
- Ending October 21:         25 days
- Ending November 18:      20 days
- Ending December 16:      19 days


. . . . . . . . . . . . . .

Stay up to date by having posts sent directly to your RSS feed or Email.

Link to Recording of Webinar with Bob Lang and Jay Wolberg

I was invited to join Bob Lang (options trading mentor at http://explosiveoptions.net, contributor to http://thestreet.com, and one of Jim Cramer's go-to technical experts on Mad Money) in a webinar yesterday. The recorded video has been posted online for anyone interested.

We had a great conversation, covering a wide variety of topics in 80 minutes. To help you find topics of interest, I've outlined our discussion along with approximate minute marks.

- Show intro (0:00)

- Bob's current market analysis (1:50)

- Into of Jay (10:15)

- Overview of Volatility (13:25)

- Role of actual market volatility in pricing of forward looking volatility (VIX) (17:18)

- What happens during  recent, brief VIX spikes which quickly revert; impact of QE (24:00)

- Common misconceptions of VXX (30:28)

- Reasons for large blocks of VIX calls (36:15)

- Reason why actual volatility may be higher than implied volatility (39:40)

- Reasons for a rising VIX while the market is rising (41.45)

- Likelihood of seeing a VIX in the 90s again (45:00)

- Reasons for current low VIX regime (47:50)

- Recent pattern of buying XIV on dips and likelihood of continuation of this pattern (51:05)

- Letting data guide trading decisions (53:25)

- XIV technical analysis -- importance of 200-day moving average (54:40)

- XIV indicators (57:30)

- Possibility of rally in XIV in today's market & levels to watch for Friday (1:00:10)

- Do VIX levels have influence on whether equities go up or down (1:02:00)

- Preparing for Black Swan events (1:03:45)

- Current decision making for trading XIV in market Friday (1:08:00)

- Signals for start of new rally in XIV (1:10:30)

- Why Thursday's move in XIV was an indicator that VIX was overbid (1:11:45)

- Tour of free resources at http://tradingvolatility.net (1:14:00)


If you are interested in learning more about trading options from a technical expert, check out Bob's website at http://explosiveoptions.net/ and follow him on Twitter at @aztecs99.


. . . . . . . . . . . . . .

Stay up to date by having posts sent directly to your RSS feed or Email.

The Quest To Outperform The Market

Chances are, if you're an active trader in this market you are struggling to make money. In reality it's a tough game, one in which hedge funds and mutual funds constantly underperform the market.  In 2012, 88% of hedge funds and 65% of mutual funds underperformed the S&P 500 benchmark. In 2013, the hedge fund average trailed the S&P 500 for the fifth straight year with a 7.4% return, 23 percentage points below the S&P 500.

Why do so many professionals and individual investors lose money? Because in order to be successful in trading you need both a good plan and the discipline to execute against the plan. Without both of these a trader will fail to make money consistently.

While we can't really help you with the discipline, we can help you with the plan. We focus most on trading two securities, VXX (the "volatility futures fund") and XIV (the "inverse volatility futures fund"), based on the direction of the fund's built-in Bias. The Bias is our proprietary way of measuring the current directional force on the fund and is primarily based on the price structure of VIX futures and the internal mechanisms that the funds use to manage their holdings. As these values change each day we measure and report on the Biases in our Daily Forecasts so that we know both their direction and magnitude.

With that information, we apply the simple strategy of buying XIV when the VXX Bias is negative, or buying VXX when the VXX Bias is positive. Trading in the direction of the Bias is critical since it can impact the price of the fund by as much as 10% per week. Trading in the direction of the Bias allows traders to take advantage of the funds structure and can provide an edge in trading.

Over the past couple years, XIV has become a popular fund to own with annual returns of 142% and 85% in 2012 and 2013, respectively. But this is not a fund to buy and hold since it is prone to 80%+ losses if the Bias reverses (see XIV: When a "Sure Thing" Goes Bad). You can see in the table below that while the average annual return of XIV is 46%*, it experienced several ugly years when there was an unfavorable Bias. Rather than suffer through these losses, XIV can be sold whenever the VXX Bias is positive to help reduce drawdowns. This "Negative VXX Bias" strategy has been shown to substantially outperform XIV in 6 of the past 8 years, with an average excess performance of 48 percentage points (far right column, below).


% Gain / Loss By Year
YearXIV"Negative VXX Bias" Strategy"Positive VXX Bias" StrategyExcess performance over XIV using "Negative VXX Bias"
200673%60%-15%-13%
2007-51%-34%13%17%
2008-71%-8%128%63%
2009103%116%-9%13%
2010135%284%42%149%
2011-47%45%61%92%
2012142%216%11%74%
201385%74%-30%-11%
Average46%94%25%48%


A look at each year's performance of the "Negative VXX Bias" strategy shows that while it is still vulnerable to losses, overall the strategy has done exceedingly well compared to the alternatives. A comparison of the annual returns of XIV vs the "Negative VXX Bias" strategy is better visualized below.


You can get a feel for how the strategy performs on a day-to-day basis by looking at the each of the performance data files (**links located at the bottom of this post). In these files you can view a graph of the daily value of a portfolio employing each strategy. The chart below compares the "Negative VXX Bias" strategy to XIV during 2011. Note the flat blue line which illustrates that XIV was not owned in the "Negative VXX Bias" strategy during the time XIV experienced steep losses because there was a positive VXX Bias.


The performance data files also contain the forecast VXX Bias values, entry and exit points, and gain/loss data including a histogram of trades. Below is a summary of trades each year for the "Negative VXX Bias" strategy.

Number Of Trades Per Year For Negative VXX Bias Strategy
Year# of TradesWinnersLosersAvg Trade Gain/Loss
200612664.94%
20071459-2.43%
20081376-0.33%
200911658.05%
201075323.34%
201110374.54%
2012115612.51%
201315874.27%


Given the size of gains & losses I've discussed so far it should be clear that these strategies typically align with traders who have a relatively high tolerance for risk. They are not for everyone and they are certainly not for anyone who does not pay attention to the changing Bias of the funds. However, if you're a trader who has decided that these types of funds are right for you, we would love to provide you with the tools to assist in your analysis and decision making process.

In addition to tracking these Biases on our website, we can also send email alerts to let subscribers know when the VXX Bias has changed direction. To learn more about the services we provide you can check out our Subscribe page, or drop us a line via the Contact page. You can also chat with us on Twitter at @tradevolatility if you like. We're here to help and answer any questions you might have about the world of volatility!


------------

*Daily prices for VXX and XIV prior to fund inception have been derived from existing VIX futures data. Backtests use each security's 4:00pm ET closing value as an approximated trade price for indicators that require VIX and VIX futures to settle at 4:15pm ET.

**Data files: 2006, 2007, 2008, 2009, 2010, 2011, 2012, 2013, 2014


------------
Hypothetical and Simulated Performance Disclaimer
The results are based on simulated or hypothetical performance results that have certain inherent limitations. Unlike the results shown in an actual performance record, these results do not represent actual trading. Also, because these trades have not actually been executed, these results may have under- or over-compensated for the impact, if any, of certain market factors, such as lack of liquidity. Simulated or hypothetical trading programs in general are also subject to the fact that they are designed with the benefit of hindsight. No representation is being made that any account will or is likely to achieve profits or losses similar to these being shown. Additional performance differences in backtests arise from the methodology of using the 4:00pm ET closing values for XIV, VXX, and ZIV as an approximated trade prices for indicators that require VIX and VIX futures to settle at 4:15pm ET.


. . . . . . . . . . . . . .

Stay up to date by having posts sent directly to your RSS feed or Email.

VXX Bias Forecast Performance Review, 2014 Year-to-Date

With one third of 2014 now behind us, it's a good time to take a look at year-to-date performance of our Bias strategy. The U.S. stock market has been mixed so far this year (through May 9, 2014) with the S&P 500 index gaining 1.6%,  the Russell 2000 down 4.8%, and the NASDAQ 100 down 1%. The VIX has lost 5.8% YTD although it has seen some wild swings already, gaining 56.3% in early February before returning back to where it started.

At Trading Volatility we focus on trading of VIX ETPs with most attention on VXX and XIV. Today we'll review the year-to-date performance of the VXX Bias forecasts, which are generated after each trading day at 4:30pm ET.
- For those of you who are unfamiliar with our daily Bias forecasts more information can be found on the Daily Forecast page.
- For backtested performance of the Bias strategy dating back to 2006 please see this post.

VXX Bias Indicator Performance, 2014 YTD (Data sheet with trade and performance details)
As usual, we'll review the performance of the indicators in two halves:
1) the "Negative VXX Bias" strategy which involves buying XIV whenever the VXX Bias is negative, and
2) the "Positive VXX Bias" strategy which involves buying VXX whenever the VXX Bias is positive.

1) Negative VXX Bias Strategy
The VXX Bias forecasts are designed to help traders identify the direction and magnitude of any headwinds/tailwinds in VXX and XIV that arise from the structure and momentum of the underlying VIX futures securities. So far this year the Bias forecasts have identified a key change in market structure in early January to give traders a chance to exit positions in XIV before the full 29% drawdown (see graph below). Confident investors sparked a stock market rebound to keep that drawdown contained, but we've seen a mostly sideways/choppy market with a neutral VXX Bias for the majority of the year. Long-time readers of our posts will know that a neutral Bias makes for little or no trading edge in VIX ETPs, making for a more difficult trading environment. However, in late April & early May we've seen the VXX Bias grow more negative and exit the neutral zone to drive new lows in VXX and drive price higher in XIV.
- As of May 9, XIV has returned 0% YTD vs +3% with the Negative VXX Bias strategy.


2) Positive VXX Bias Strategy
We've seen several moves to a positive VXX Bias this year but only one instance has lasted more than a handful of days. In the January instance the VXX Bias remained positive for 13 days, with VXX gaining over 30% before finally closing out a 10.8% gain. Most of the remaining VXX trades have ended with small losses in typical VXX behavior. 2014 has once again demonstrated that while VXX can see good short-term gains, they tend to be fleeting when the Bias quickly returns to negative.


------------
Hypothetical and Simulated Performance Disclaimer
TThe results are based on simulated or hypothetical performance results that have certain inherent limitations. Unlike the results shown in an actual performance record, these results do not represent actual trading. Also, because these trades have not actually been executed, these results may have under- or over-compensated for the impact, if any, of certain market factors, such as lack of liquidity. Simulated or hypothetical trading programs in general are also subject to the fact that they are designed with the benefit of hindsight. No representation is being made that any account will or is likely to achieve profits or losses similar to these being shown. Additional performance differences in backtests arise from the methodology of using the 4:00pm ET closing values for XIV, VXX, and ZIV as an approximated trade prices for indicators that require VIX and VIX futures to settle at 4:15pm ET.


. . . . . . . . . . . . . .

Stay up to date by having posts sent directly to your RSS feed or Email.

Shorting Volatility: Time To Reduce Profit Expectations for 2014

With XIV down 7.6% so far this year after seeing 100%+ annual returns in both 2012 and 2013, many have been asking "Is the short volatility trade dead in 2014?" While my terse answer is "not necessarily," we need to take a closer look at the various aspects of the VIX futures market in order to gain some insight on where VIX ETFs could be headed.

The idea of reduced profit expectations for XIV is actually not new. Although XIV gained 107% in 2013, its gains have slowed to just +36% over the past 12 months. While we've talked about this several times last year (here and here and here), today we'll talk about why and take a look at the current outlook.


VIX Futures
The daily price movement of XIV/SVXY, VXX and UVXY/TVIX are determined by the price of the front two months of VIX futures. In the chart below you can see both front month (M1) and second month (M2) VIX futures over the past 12 months.


Current values of M1 (14.85) and M2 (15.75) are generally in the lower-middle portion of the range. We've seen these M1 & M2 price levels with a similar ~1 point spread before. In fact, M1 and M2 are essentially unchanged from 12 months ago and we've seen the same levels six other times during the past year (4/26, 7/29, 9/16, 10/30, 12/3, and 12/19). On all of these occasions we've seen M1 and M2 continue to fall, providing an average gain for XIV of 9% over the next 1-2 weeks. These gains tend to be short-lived as multi-day volatility spikes have resulted in 15%+ drawdowns in XIV for 5 of the 7 instances (exception were 10/30/13 and 12/3/13). This doesn't mean that the same thing will happen this time around, but it does provide some interesting data points.

We can see these moves reflected in the 1-year chart of XIV, below. While VIX futures are essentially unchanged over the past 12 months, monthly expiring futures and the roll yield continue to provide fuel for gains in XIV, which is +36% over the past 12 months (and VXX is -47%). There's no reason this dance can't continue at this "slower" rate as long as M1 and M2 remain range bound under 20, but periodic drawdowns are likely to continue resulting in choppy trading.


As a relevant side note, 3 month actual volatility in the S&P 500 (HV60) has risen about 1.3 points over the course of the past five months. This often serves as an approximate lower-bounds for VIX, as we can see in the HV-IV chart below (see green circles). This means VIX is less likely to soon push back down into the 11.9/12.3 range we saw late last year.


VXX Roll Yield
In addition to looking at the relative position of front month VIX futures, we need to also look at the headwind/tailwind for the securities that arises from the roll yield. The roll yield is proportional to the difference between the 1st and 2nd month VIX futures. Below I've charted VXX's weekly roll yield (WRY) over the past two years.


You can see how the roll yield for VXX has been much less negative so far this year, providing for less of a headwind for VXX and less of a tailwind for XIV/SVXY. In fact, so far this year the average VXX WRY has been just -0.7% (which is +0.7% for XIV). To put that number in context, below is a table of the average XIV weekly roll yield for each of the past 9 years.

XIV: Average Weekly Roll Yield vs. Annual Return
Year Avg WRY Annual Return
2005 1.6% 101%
2006 1.4% 14%
2007 0.6% -35%
2008 -0.6% -71%
2009 0.9% 118%
2010 2.1% 144%
2011 0.5% -46%
2012 2.1% 154%
2013 1.6% 107%
2014  0.7% -8% (YTD)


The 2014 average WRY is more or less in the middle of the range between the low (-0.6%) and high (+2.1%). So why is this important? Because the return of VIX ETFs is largely dependent on the roll yield. as illustrated by a scatter plot for the above table.


You can largely expect that the return of XIV 2014 will end up somewhere along this line. Think about this chart for another minute. Essentially the trendline is telling us that XIV needs an average WRY of at least 0.5% to have a chance at being positive for the year. Factor in a few 25%+ XIV drawdowns and realistically it needs an average WRY of 1% to really provide some confidence in the trade. With VIX futures already quite compressed along the entire term structure, that 1% WRY will be difficult to maintain unless M1 is able to spend much more time in the 13s. This would imply a VIX down in the 11-12 range -- quite a tall order at the moment.

Outliers on the graph above are the result of either a) major differences of the yearly starting and ending values of M1 (i.e. in 2009 M1 went from 45 to 20), or b) large multi-day volatility spikes that cause major (50%+) drawdowns in XIV (e.g. 2006, 2007, 2011) which are difficult to recover from based on the dynamics of percentages (i.e. it takes a 100% gain to fully recover from a 50% loss). For reference, below is a chart showing the value of front month VIX futures over the past 9 years (note that while M1 is low compared to the recent 5 years, it is still higher than most of 2005 and 2006).


VXX Forecast Review
As I turn to look at our daily VXX Bias Forecasts history, below, you can see why we identify the area between -1 and +1 as a "neutral zone" (highlighted in yellow) which is subject to a certain amount of thrash. These are are times when VXX generally moves sideways and is more susceptible to spikes. After looking at this forecast history it's not much of a surprise to learn that neither VXX (-1.7%) nor XIV (-7.6%) have gone anywhere this year.


Summarizing the current situation for XIV (and VXX/UVXY):
  • We've seen a narrow XIV weekly roll yield so far in 2014, but it has been increasing lately to the point where it is back above 1%. If XIV is going to continue to see gains the WRY needs to stay above this level. 
  • VIX futures are at the lower end of the range over the past few years. They've been at these levels and can continue lower, but their downside is more limited than the upside at this point, making for a pretty non-ideal time to aggressively short volatility. 
  • XIV has the potential to continue to rise as VIX futures roll forward each month. The next expiration date is April 16th.


. . . . . . . . . . . . . .

Stay up to date by having posts sent directly to your RSS feed or Email.

2014: Is It Still Profitable To Be Short VXX?

The markets are off to a bit of a rocky start to the year, particularly in the last couple of weeks. This is a distinct change of pace after a rather quiet end to 2013. VXX is +6.84% YTD after hitting a high of +30% on Wednesday. Will VXX see another year like 2012 and 2013 with losses of 60%? Or are we likely to see performance closer to 2011?

In this post I'll cover:
  • VIX Technical Review
  • Forecast Review
  • Trading Outlook
  • Trading Plan

VIX Technical Review 
VIX broke out above its 200SMA (14.4) on Jan 24 to start a rally that peaked at 21.48 seven days later. Since then it has quickly retreated and is approaching the 200SMA (now at 14.57) from the other direction. There are some other notable moving averages in the 14.4-14.9 area including the 100SMA, 50SMA, 60EMA, 90EMA and the lower envelope of the 10-2 Bollinger Band, as well as support levels established by previous VIX spikes. This suggests another 5% downside in VIX before support.


Taking a look at VIX futures (chart below), we went into backwardation for a day on Jan 24 and returned for six more days from Jan 30 through Feb 6. This was the longest string of backwardation we've seen since the the Aug 2011 selloff. The impact that backwardation and rising VIX futures have on the price movement of VIX ETF was made clear as XIV fell 30% from its Jan 22 close to its Feb 5 low. Although XIV has recovered somewhat and is down "only" 17% from Jan 22, it is still at risk for further declines should we see a move back to backwardation (also see "XIV: When a 'Sure Thing' Goes Bad").

This was a relatively mild volatility spike with VIX reaching just beyond its long term average of 19.8. Should this move in VIX continue to be more than just a blip on the radar, XIV could see some major losses. We're now back in a slight contango after Friday with Feb at 15.47 and March at 15.88. Feb VIX futures are 1% above spot VIX, which is a very small premium with six trading days left before Feb VIX futures expire. Typically you can expect VIX and expiring VIX futures to remain pretty well coupled as we approach expiration.


Forecast Review
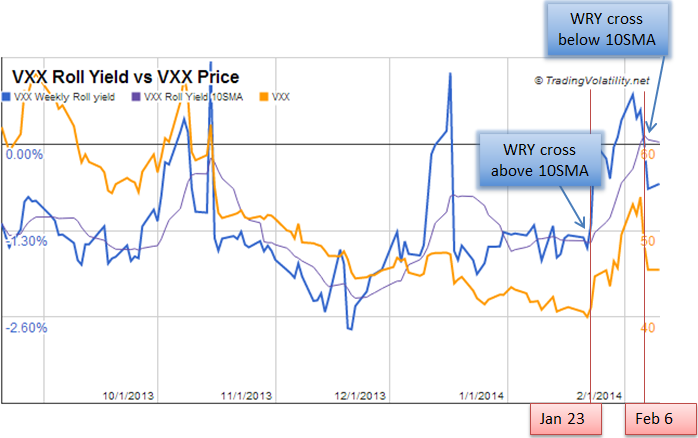
With the expectation for a more dynamic market in 2014, we've been using the signals from our WRY-10SMA indicator in addition to our Bias forecasting signals to guide us in trading. This provides us with additional signals to help avoid short-term drawdowns. After a choppy and sideways January we saw a move in the VXX Weekly Roll Yield above its 10SMA on January 23rd. Combining this with a confirming MACD signal in the VIX on that same day, we went long VXX, selling a potion on the 24th and the remainder on the 27th to lock in 11% gains. This turned out to be premature as the WRY stayed above its 10SMA for 7 more days and an additional 19% gain in VXX, but I find it's always good to take profits in VXX before they disappear. (Note: we will soon be updating our WRY-10SMA indicator to reduce the amount of signal noise by utilizing exponential moving averages.)


Looking at our Bias forecast over the past six months, the negative bias on VXX has been trending smaller resulting in a more difficult short of VXX.


Our VXX Spike Risk forecasts showed a substantially elevated risk over the last few of weeks rising from 25% up to 70%.


Trading Outlook 
First and foremost, let's respect the fact that the market is moving higher, the VXX bias is back to negative, and the VXX WRY is below its 10SMA. Follow this trend and see how we do with the various levels of resistance in the S&P 500 next week (1810 and 1820). Let's also respect the fact that XIV dropped 30% on a modest 5% pullback of the S&P. We are in a relatively old bull market which is rather complacent and investors are heavily leveraged while shorting volatility is a crowded market. We don't yet know if the emerging market issues from the past 2 weeks were just noise or the start of a real problem. When we hit a real problem somewhere down the line VIX will spike quickly and severely and I, for one, don't want to be heavy on the wrong side of the trade when it does.


Trading Plan
Please login to the Members' Forum to finish reading this article. If you're not yet a member you can join via the Subscribe page.


. . . . . . . . . . . . . .

Stay up to date by having posts sent directly to your RSS feed or Email.