Showing posts with label monthly trade performance. Show all posts

Holiday Subscription Price Discount

We are celebrating the holiday season and an awesome trading year with major discounts to our Trading Volatility+ service!

Trading Volatility+ (billed monthly):  $200/mo   $110/mo
Trading Volatility+ (billed quarterly): $180/mo     $90/mo

The Trading Volatility+ service provides access to our proprietary indicators for monitoring volatility ETPs, with performance in 2017 that has reached triple-digit returns, as shown by third-party auto-trading tracking. And that's on the heels of a 75% gain in 2016.


Our automated signals to buy and sell XIV and VXX grew a $100,000 reference portfolio into $353,000 since launching on the Collective2 platform in Feb 2016 (actual trade data for this system, including trade date & time stamps, share quantity and trade price is tracked by, and made available, on Collective2).


Better yet, this performance was achieved with only 26 trades, meaning you don't have to spend much of your time executing trades or excessively focusing on the market.

Our automated signals are sent to subscribers via email or text, with final alerts arriving at 4:32pm ET and preliminary alerts sent at 3:46pm ET. Subscribers also have access to our Intraday Indicators on our website which display updated indicator values throughout the trading day.

For those of you waiting for a final push to subscribe to our service, this is it. Feel more comfortable trading XIV, SVXY, VXX, and UVXY in 2018 by using proven indicators.

If you'd like to learn more about our strategies, please visit our Strategy Page or contact us via email.

Thank you and have a great Holiday Season!


. . . . . . . . . . . . . .

Stay up to date by having posts sent directly to your RSS feed or Email.

Our 2016 Indicator Performance: +96%

Our indicators had a really nice 2016, with our flagship VRP+VXX Bias indicator finishing +96% and our VXX Bias +149%.

The first quarter checkpoint of +59% set a great tone for the year while our July checkpoint of +91% YTD put us close to where we finished for the year after going through a volatile third quarter. Our equity curve for 2016 using a hypothetical portfolio is as follows:


Below is how our indicators performed when we sent our trade orders through Collective2's auto-trading platform (since launch in February 2016), echoing the above equity curves.1


VRP+VXX Bias ("Trading Volatility 1")


VXX Bias:


2016 will go down in the books as a below average for the VRP+VXX Bias strategy's +96%, while VXX Bias's +149% ranks in the top three among all backtest years.


Updated statistics:


Values for monthly returns have been tracked along the way and published on our Strategy page.

Trading Volatility+ subscribers have access to our VRP and VXX Bias indicators, our intraday indicator data, receive emails with preliminary and final change alerts for each of the indicators as well as our daily summaries, and interact with our private community of volatility traders in the forum. If interested, you can learn more about our services on our Subscribe page.

As always, each day's indicator values, buy/sell triggers, trade performance summary, and equity curves are tracked in the spreadsheets linked at the bottom of our Subscribe page. Additional information on our trading strategy and indicators can be found on our Strategy page.


1Note: As mentioned in our previous post, you will find differences between the ideal/hypothetical indicator performance and actual trading performance for the following reasons:
- The VRP+VXX Bias indicator ("Trading Volatility 1" on C2) was launched on C2 on Feb 2, 2016.
- The VXX Bias indicator was launched on C2 on Feb 19, 2016
- Both C2 systems traded only 72%-80% of portfolio equity until April 1. After April 1, both C2 systems trade at ~97.5% portfolio equity (the ideal/hypothetical model portfolios trade at 100% equity).
- The ideal/hypothetical performance does not account for trade commissions or subscriptions costs.


------------
Hypothetical and Simulated Performance Disclaimer
The results are based on simulated or hypothetical performance results that have certain inherent limitations. Unlike the results shown in an actual performance record, these results do not represent actual trading. Also, because these trades have not actually been executed, these results may have under- or over-compensated for the impact, if any, of certain market factors, such as lack of liquidity. Simulated or hypothetical trading programs in general are also subject to the fact that they are designed with the benefit of hindsight. No representation is being made that any account will or is likely to achieve profits or losses similar to these being shown. Hypothetical and backtest results do not account for any costs associated with trade commissions or subscription costs. Additional performance differences in backtests arise from the methodology of using the 4:00pm ET closing values for XIV, VXX, and ZIV as approximated trade prices for indicators that require VIX and VIX futures to settle at 4:15pm ET.


. . . . . . . . . . . . . .

Stay up to date by having posts sent directly to your RSS feed or Email.

The Most Important Chart For Trading Volatility ETPs

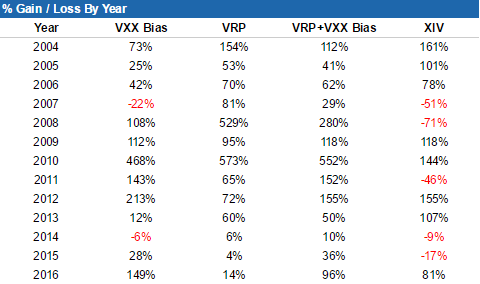
On April 5, 2014 I wrote an article titled Shorting Volatility: Time To Reduce Profit Expectations for 2014 which outlined why I thought it would be difficult for XIV (the fund which tracks the inverse daily return of volatility futures) to finish positive for 2014. When the article was published XIV had returned an impressive +547% over the past 28 months, as shown in the chart below.


Understandably, many people disagreed with my view, yet XIV finished the 2014 year -9%.

Later in 2014 (September) I wrote The End of an Era for the Market, in which I discussed how a choppy market that is no longer a reliable environment for shorting volatility had become the norm as the Fed concluded their QE program. XIV lost 37% of its value over the next four months and is currently down 30% since that post.

If it wasn't already clear, XIV is not a buy and hold security. It has returned -20% over the past year and -7% over the past two years. The environment is not the same as what it was in 2012 and 2013.

How did I make these calls?

Because returns in XIV are heavily dependent on the Weekly Roll Yield (WRY).

A major factor for the lower returns in the past two years comes from a smaller weekly roll yield that is used to propel XIV. The inverse of the XIV WRY is the VXX WRY (which comes from the difference between first and second month VIX futures). We track this important metric on our site, and as you can see in the graph below, the roll yield has moved from -2% to -1% over the past several years and has recently started to move toward 0%.


This is most important graph because the WRY serves as a headwind or tailwind to VIX ETPs. As the WRY approaches zero, trends become less stable and our advantage in trading XIV or VXX diminishes. Conversely, as the WRY moves away from zero trends become stronger.

Right now there is less of a headwind for VXX and less of a tailwind for XIV/SVXY. At this point in our old bull market we are also at high risk for the VXX WRY turning positive, which would give VXX a tailwind and XIV a headwind.

Revisiting our graph which compares the annual returns of XIV to the average Weekly Roll Yield (below), we can see why the WRY is so important.


Looking at the trendline we can see that with a fairly constant 1% WRY, we can generally expect XIV to return ~+25% per year. As the average WRY moves towards 2% we can expect XIV to return ~+120% per year.  At 0%, XIV is likely to return ~-60%. The recent shrinking of the WRY from 2% to 1% has an enormous impact on returns and that's why it is so important. A continued move of the WRY toward 0% or higher would be alarming to investors who plan to buy-and-hold XIV.

Because the WRY is such an important factor in the performance of VIX ETPs, our approach is to trade XIV and VXX using the WRY as a primary input for our VXX Bias and ZIV Bias indicators (our strategies are outlined here). While XIV is negative on the year, our VXX Bias indicator has put forth a performance of +33% YTD.

No credible trader will ever say that trading is easy, and that is doubly true when it comes to volatility. It requires a deep understanding of market forces, a solid process-oriented plan, and discipline in execution. In the current environment it will be more important than ever to stay on top of changing conditions.

We have been in the business of helping traders stay on top of the volatility market for three years now. We look forward to a fourth year of providing a variety of free data services throughout our website and are always happy to answer questions submitted through our Contact page. We also offer subscriber services to people looking for additional data, metrics, automated alerts and daily summaries, and access to a community of volatility traders. If you're interested, don't hesitate to drop us a line.


------------
Hypothetical and Simulated Performance Disclaimer
The results are based on simulated or hypothetical performance results that have certain inherent limitations. Unlike the results shown in an actual performance record, these results do not represent actual trading. Also, because these trades have not actually been executed, these results may have under- or over-compensated for the impact, if any, of certain market factors, such as lack of liquidity. Simulated or hypothetical trading programs in general are also subject to the fact that they are designed with the benefit of hindsight. No representation is being made that any account will or is likely to achieve profits or losses similar to these being shown. Additional performance differences in backtests arise from the methodology of using the 4:00pm ET closing values for XIV, VXX, and ZIV as approximated trade prices for indicators that require VIX and VIX futures to settle at 4:15pm ET.


. . . . . . . . . . . . . .

Stay up to date by having posts sent directly to your RSS feed or Email.