

First Quarter Indicator Results
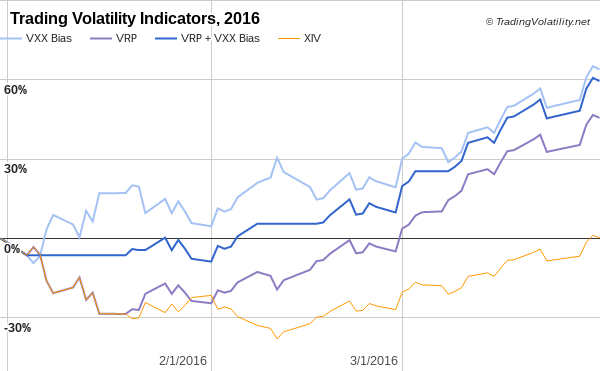
The Trading Volatility indicators had a bit of a slow start in the first month of 2016 but rallied strong off of February's market low. Our VRP+VXX Bias indicator finished at +59% for the first quarter of 2016, while our VXX Bias came in at +64%. Our VRP indicator finished the quarter at +46%.
Below is the first quarter equity curve for the Trading Volatility indicators versus XIV (buy and hold):
For those interested in additional details of the indicators, the daily history of indicator values that have been emailed to subscribers in 2016 can be found in the data sheet links below:
- VXX Bias: 2016
- VRP: 2016
- VRP+VXX Bias: 2016
Launch of Auto-Trading
While I'm happy about the performance over the first quarter I'm even happier about the new option of auto-trading our indicators on Collective2's platform. As I announced a couple months ago, you can now have trades automatically placed in your brokerage account whenever the VRP+VXX Bias indicator changes. Since that post, we have added auto-trading for the VXX Bias indicator as well. Both strategies are available on Collective2 at an 85% discount for active Trading Volatility+ subscribers.
I have previously written that the key to successful investing is to have a solid plan as well as the discipline to be able to execute against it. Having our indicators automated does exactly that.
No more worrying about missing trades because I'm too busy.
No more emotional barriers making me wonder if I'm making the right decision to buy or sell.
No more distractions from the noise of daily market movements.
No more being tied to a trading screen all day.
The indicators now execute against the plan automatically and actual trades are tracked on Collective2's site at the following pages: VRP+VXX Bias indicator & VXX Bias indicator
Nothing changes for the existing Trading Volatility+ service. Subscribers will continue to have access to our intraday indicator data, receive emails with preliminary and final change alerts for each of the indicators as well as our daily summaries, and interact with our private community of volatility traders in the forum. If interested, you can learn more about our services on our Subscribe page.
As always, each day's indicator values, buy/sell triggers, trade performance summary, and equity curves are tracked in the spreadsheets linked at the bottom of our Subscribe page. Additional information on our trading strategy and indicators can be found on our Strategy page.
------------
Hypothetical and Simulated Performance Disclaimer
The results are based on simulated or hypothetical performance results that have certain inherent limitations. Unlike the results shown in an actual performance record, these results do not represent actual trading. Also, because these trades have not actually been executed, these results may have under- or over-compensated for the impact, if any, of certain market factors, such as lack of liquidity. Simulated or hypothetical trading programs in general are also subject to the fact that they are designed with the benefit of hindsight. No representation is being made that any account will or is likely to achieve profits or losses similar to these being shown. Additional performance differences in backtests arise from the methodology of using the 4:00pm ET closing values for XIV, VXX, and ZIV as approximated trade prices for indicators that require VIX and VIX futures to settle at 4:15pm ET.
