Showing posts with label XIV. Show all posts

XIV Is No More

Market action on Monday this week resulted in the all-time record for a 1-day spike in VIX at 115.6%. This also caused our beloved XIV to implode and alas, it no longer exists.

SVXY, a nearly identical product managed by ProShares, managed to survive the carnage although it lost most of its value. Other inverse volatility products including ZIV, VMIN, and XIVH are still around as well. We plan to move to SVXY and continue business as usual.

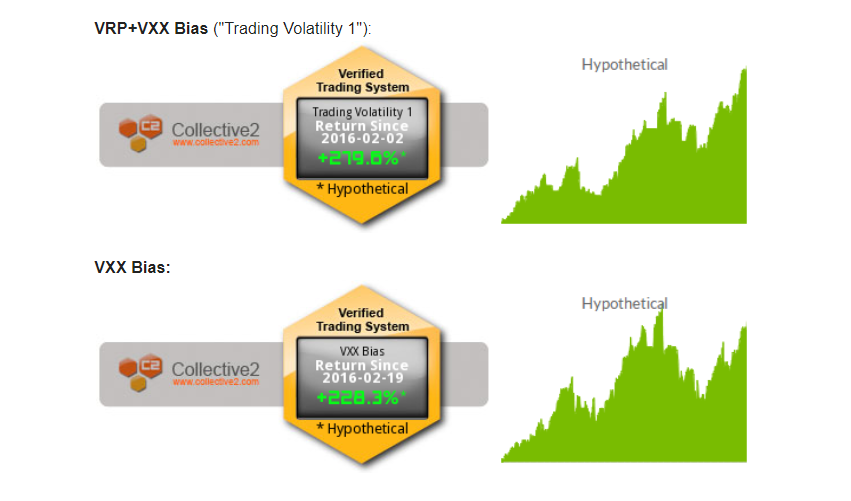
Speaking of business as usual, below is our performance of our indicators through Feb 8, 2018, as auto-traded on Collective2:


. . . . . . . . . . . . . .

Stay up to date by having posts sent directly to your RSS feed or Email.

Our 2017 Indicator Performance: +126%

We had a great 2016 with our primary indicator turning in a +96% gain, but 2017 was even better with a +126% gain. It was a bit of a wild journey, however, with a political headlines and threats of nuclear war popping up to cause some pretty strong drawdowns mid-year. Our equity curve for 2017 using hypothetical portfolios is as follows:


Below is how our indicators performed when we sent our trade orders through Collective2's auto-trading platform (performance values and graphs here date back to launch in February 2016), echoing the above equity curves.1

Both our VXX Bias and VRP+VXX Bias strategies were bested by a buy-and-hold approach with XIV in 2017 as it set a new record for best annual return. However, knowing that it is not a good idea to buy and hold XIV, I believe the VRP+VXX Bias performance was still rather good and it helped us to sell when it detected trouble coming our way.


Updated statistics:


Values for monthly returns have been tracked along the way and are updated on our Strategy page as well as below.


Trading Volatility+ subscribers have access to our VRP and VXX Bias indicators, our intraday indicator data, receive emails with preliminary and final change alerts for each of the indicators as well as our daily summaries, and interact with our private community of volatility traders in the forum. If interested, you can learn more about our services on our Subscribe page.

As always, each day's indicator values, buy/sell triggers, trade performance summary, and equity curves are tracked in the spreadsheets linked at the bottom of our Subscribe page. Additional information on our trading strategy and indicators can be found on our Strategy page.

1Note: As mentioned in our previous post, you will find differences between the ideal/hypothetical indicator performance and actual trading performance for the following reasons:
- The VRP+VXX Bias indicator ("Trading Volatility 1" on C2) was launched on C2 on Feb 2, 2016.
- The VXX Bias indicator was launched on C2 on Feb 19, 2016
- Both C2 systems traded only 72%-80% of portfolio equity until April 1. After April 1, both C2 systems trade at ~97.5% portfolio equity (the ideal/hypothetical model portfolios trade at 100% equity).
- The ideal/hypothetical performance does not account for trade commissions or subscriptions costs.

------------
Hypothetical and Simulated Performance Disclaimer
The results are based on simulated or hypothetical performance results that have certain inherent limitations. Unlike the results shown in an actual performance record, these results do not represent actual trading. Also, because these trades have not actually been executed, these results may have under- or over-compensated for the impact, if any, of certain market factors, such as lack of liquidity. Simulated or hypothetical trading programs in general are also subject to the fact that they are designed with the benefit of hindsight. No representation is being made that any account will or is likely to achieve profits or losses similar to these being shown. Hypothetical and backtest results do not account for any costs associated with trade commissions or subscription costs. Additional performance differences in backtests arise from the methodology of using the 4:00pm ET closing values for XIV, VXX, and ZIV as approximated trade prices for indicators that require VIX and VIX futures to settle at 4:15pm ET.


. . . . . . . . . . . . . .

Stay up to date by having posts sent directly to your RSS feed or Email.

Our Indicator Performance: +82% YTD Through November

It is time again for a year-to-date performance update of our indicators.

First, we have the hypothetical results using the daily indicators values in our model simulations (using ~100% equity on trades and assuming zero trade commissions). Here is the daily equity curve of all indicators, compared to XIV (buy-and-hold):

As you can see, the YTD performance of our indicators using hypothetical models has come down a bit since our update in July and subsequent peak on September 7th. Despite this lull, 2016 has been a very good year for us. Through November, the performance now sits at:
- VRP+VXX Bias: +82%
- VXX Bias: +122%
- VRP: +7%

For reference, 2016 performance of the publicly-traded "short volatility ETN" (ticker: XIV) and the "long volatility ETF" (ticker: VXX) are at:
- XIV (buy and hold): +69%
- VXX (buy and hold): -65%


Auto-Trade Performance on Collective2
We have tracked our actual trades and performance on Collective2's site since February 2016 (links: VRP+VXX Bias & VXX Bias). Our VRP+VXX Bias and VXX Bias indicators and both 100% automated algorithms which send signals to Collective2's platform for auto-trade execution in our trading account and performance tracking.1

From launch (February 2016) through November, performance on the auto-trade systems sit at:
- VRP+VXX Bias: +65%
- VXX Bias: +83%
- VRP: (not auto-traded)

As of last week, the current cumulative returns for our strategies auto-traded on Collective2 will be updated daily on our Strategy Page.

Compared to the indicators' historical record, 2016 is currently sitting around average for the year. Also posted on our Strategy Page, we have the monthly and annualized statistics for each of our strategies compared to XIV (buy-and-hold):


Trading Volatility+ subscribers have access to our VRP and VXX Bias indicators, our intraday indicator data, receive emails with preliminary and final change alerts for each of the indicators as well as our daily summaries, and interact with our private community of volatility traders in the forum. If interested, you can learn more about our services on our Subscribe page.

As always, each day's indicator values, buy/sell triggers, trade performance summary, and equity curves are tracked in the spreadsheets linked at the bottom of our Subscribe page. Additional information on our trading strategy and indicators can be found on our Strategy page.


1Note: As mentioned in our previous post, you will find differences between the ideal/hypothetical indicator performance and actual trading performance for the following reasons:
- The VRP+VXX Bias indicator ("Trading Volatility 1" on C2) was launched on C2 on Feb 2, 2016.
- The VXX Bias indicator was launched on C2 on Feb 19, 2016
- Both C2 systems traded only 72%-80% of portfolio equity until April 1. After April 1, both C2 systems trade at ~97.5% portfolio equity (the ideal/hypothetical model portfolios trade at 100% equity).
- The ideal/hypothetical performance does not account for trade commissions or subscriptions costs.

------------
Hypothetical and Simulated Performance Disclaimer
The results are based on simulated or hypothetical performance results that have certain inherent limitations. Unlike the results shown in an actual performance record, these results do not represent actual trading. Also, because these trades have not actually been executed, these results may have under- or over-compensated for the impact, if any, of certain market factors, such as lack of liquidity. Simulated or hypothetical trading programs in general are also subject to the fact that they are designed with the benefit of hindsight. No representation is being made that any account will or is likely to achieve profits or losses similar to these being shown. Hypothetical and backtest results do not account for any costs associated with trade commissions or subscription costs. Additional performance differences in backtests arise from the methodology of using the 4:00pm ET closing values for XIV, VXX, and ZIV as approximated trade prices for indicators that require VIX and VIX futures to settle at 4:15pm ET.


. . . . . . . . . . . . . .

Stay up to date by having posts sent directly to your RSS feed or Email.

Our Indicator Performance: +91% YTD Through July

With year-to-date performance numbers that look too good to be true, it's a good thing we started having our actual trades and performance tracked using Collective2's auto-trading capabilities earlier this year.

First, our indicator performance in 2016 (through July):
- VRP+VXX Bias: +91%
- VXX Bias: +142%
- VRP: +16%

Performance in 2016 of the "short volatility ETN" (ticker: XIV) and the "long volatility ETN" (ticker: VXX):
- XIV (buy and hold): +31%
- VXX (buy and hold): -49%

The daily equity curve of all indicators, compared to XIV (buy-and-hold):


Actual Trade Performance
Our VRP+VXX Bias and VXX Bias indicators and both 100% automated algorithms which send signals to Collective2's platform for auto-trade execution in our trading account (NOTE: we do not trade the standalone VRP strategy).

Our actual trades and performance can be found on Collective2's site (links: VRP+VXX Bias & VXX Bias). You will find differences between the ideal indicator performance (above) and actual trading performance for the following reasons:
- The VRP+VXX Bias indicator ("Trading Volatility 1" on C2) was launched on C2 on Feb 2, 2016.
- The VXX Bias indicator was launched on C2 on Feb 19, 2016
- Both C2 systems traded only 72%-80% of portfolio equity until April 1. After April 1, both C2 systems trade at ~97.5% portfolio equity (ideal indicator performance assumes ~100% use of equity).

Compared to the indicators' track record, 2016 has the potential to be an above average year. As posted on our Strategy Page, we have the annual statistics for each of our strategies compared to XIV (buy-and-hold):


We also now track our strategy statistics on a monthly timeframe:


One other observations is that trading has been less active than usual this year with only 7 trades so far for VRP+VXX Bias and 5 trades for VXX Bias.

All-in-all it's been a good year so far. It will be interesting to see how the rest of the year unfolds.


------------
Hypothetical and Simulated Performance Disclaimer
The results are based on simulated or hypothetical performance results that have certain inherent limitations. Unlike the results shown in an actual performance record, these results do not represent actual trading. Also, because these trades have not actually been executed, these results may have under- or over-compensated for the impact, if any, of certain market factors, such as lack of liquidity. Simulated or hypothetical trading programs in general are also subject to the fact that they are designed with the benefit of hindsight. No representation is being made that any account will or is likely to achieve profits or losses similar to these being shown. Additional performance differences in backtests arise from the methodology of using the 4:00pm ET closing values for XIV, VXX, and ZIV as approximated trade prices for indicators that require VIX and VIX futures to settle at 4:15pm ET.


. . . . . . . . . . . . . .

Stay up to date by having posts sent directly to your RSS feed or Email.

Automated Trading For Our VRP+VXX Bias Strategy

By popular request, we have made it dramatically easier for people to trade our leading indicator, the VRP+VXX Bias.

Our VRP+VXX Bias strategy, which returned 36% in 2015, is now available for auto-trading using Collective2's world-class automatic trading platform.

One of the biggest problems for traders and investors is discipline in execution. Scheduling conflicts, emotional barriers, trading fatigue, and lack of confidence can all lead to a deviation from proper trading plan execution. Automation is key in eliminating these common trading pitfalls.

This link is the new home of the VRP+VXX Bias strategy on the Collective2 website where you can follow the trading record, statistics, and a description of the product.

Auto-Trade At An 85% Discount**
Subscribers to our Trading Volatility+ service will receive an 85% discount on the C2 auto-trading service for as long as you remain a Trading Volatility+ subscriber (contact us for a coupon code).

7-Day Free Trial
Sign up at Collective2 for a 7-day free trial with no commitment and see what you think!

More Information On Collective2's Auto-Trading Platform
Collective2's auto-trading platform allows you to have the trades in our strategy mirrored in your own brokerage account. You control the brokerage firm, the trade size, and the ability to intervene to take profits or place your own stops. See here for additional information on their auto-trading and the list of compatible brokers.

Details On Our Automated Trading Plan
The trading execution on the C2 platform utilizes automated buy and sell signals from our VRP+VXX Bias indicator. The following are the detailed mechanics of this automated trading system:
- Trades will be placed at 3:57pm ET if our indicators detect a change in direction.
- Since our VRP+VXX Bias values become official at 4:33pm ET, any discrepancies with the official signal will be resolved at the open of the next trading session.
- This strategy is in 100% cash approximately 30% of the time.
- This strategy typically makes 20-30 trades per year.
- All VXX trades are entered with a 6% stop loss.
- All XIV trades are entered with a 10% stop loss.
- Additional data on our VRP+VXX Bias strategy can be found on our Strategy page.


** Promotional discount offerings subject to change without notice.


. . . . . . . . . . . . . .

Stay up to date by having posts sent directly to your RSS feed or Email.

Our 2015 Indicator Performance: +36%

2015 was a difficult year in the investing world. As it turns out, one of the best performing assets last year was cash since most other asset classes lost money.

According to CNBC, 2015 was the hardest year to make money in 78 years. Investment legends struggled with David Einhorn's Greenlight Capital and Bill Ackman's Pershing Square fund both losing 20%, while average hedge fund performance did not breakeven. In the process, 31 hedge funds shut down during 2015.

It is against this backdrop that we highlight our own struggle in 2015: +36% for our primary indicator (the VRP+VXX Bias).

The end results were respectable, but getting there was anything but easy. The second half of the year was fairly stressful and a bit disappointing given that it was +77% in June. The 2015 equity curve for each of our indicators for trading XIV & VXX, along with XIV's performance, is shown in the following graph.


Drawdowns were painful with VXX Bias experiencing a 43% drawdown in August, fully recovering and hitting a new peak of +94% YTD on September 1st, only to be followed by a 40% drawdown in October. VRP+VXX Bias strategy also experienced a 40% drawdown in the second half of the year and was not able to recapture its +77% high from June before year end.

For the more experienced traders these drawdowns were rather unpleasant. For the uninitiated, the drawdowns were probably enough to make them call it quits. But in the end, it was another year of outperforming just about everything by a large margin with only a couple dozen trades.

In order to compare our results to other known volatility strategies I've included Volatility Made Simple's 2015 performance graph for 24 strategies, below.  Only the VIX vs VXV strategy outperformed our VRP+VXX Bias in 2015, but that strategy's long-term performance remains comparatively poor and suffers from inconsistency (57.6% avg annual return, 0.93 Sharpe ratio, and 70.6% max drawdown).


ZIV Bias Indicator
At -2%, ZIV (the medium-term VIX Futures inverse fund) once again outperformed XIV, which came in at -17% for 2015. While the ZIV Bias indicator was successful in its goal of keeping traders in cash and out of August's major drawdown, it faltered a bit during the choppy trading at the very beginning and end of the year. Ultimately, the ZIV Bias indicator underperformed buy-and-hold this year with a -9%.


As always, each day's indicator values, buy/sell triggers, trade performance summary, and equity curves are tracked in the spreadsheets linked at the bottom of our Subscribe page. Additional information on our trading strategy and indicators can be found on our Strategy page.

Trading Volatility+ subscribers have the benefit of seeing our intraday indicator data, receiving emails with preliminary and final change alerts for each of the indicators as well as our daily summaries, and interacting with our private community of volatility traders in the forum. If interested, you can learn more about our services on our Subscribe page.

2016 is already shaping up to be another exciting year for Trading Volatility. We'd love to have you join us in taking on this difficult market!


------------
Hypothetical and Simulated Performance Disclaimer
The results are based on simulated or hypothetical performance results that have certain inherent limitations. Unlike the results shown in an actual performance record, these results do not represent actual trading. Also, because these trades have not actually been executed, these results may have under- or over-compensated for the impact, if any, of certain market factors, such as lack of liquidity. Simulated or hypothetical trading programs in general are also subject to the fact that they are designed with the benefit of hindsight. No representation is being made that any account will or is likely to achieve profits or losses similar to these being shown. Additional performance differences in backtests arise from the methodology of using the 4:00pm ET closing values for XIV, VXX, and ZIV as approximated trade prices for indicators that require VIX and VIX futures to settle at 4:15pm ET.


. . . . . . . . . . . . . .

Stay up to date by having posts sent directly to your RSS feed or Email.

The Most Important Chart For Trading Volatility ETPs

On April 5, 2014 I wrote an article titled Shorting Volatility: Time To Reduce Profit Expectations for 2014 which outlined why I thought it would be difficult for XIV (the fund which tracks the inverse daily return of volatility futures) to finish positive for 2014. When the article was published XIV had returned an impressive +547% over the past 28 months, as shown in the chart below.


Understandably, many people disagreed with my view, yet XIV finished the 2014 year -9%.

Later in 2014 (September) I wrote The End of an Era for the Market, in which I discussed how a choppy market that is no longer a reliable environment for shorting volatility had become the norm as the Fed concluded their QE program. XIV lost 37% of its value over the next four months and is currently down 30% since that post.

If it wasn't already clear, XIV is not a buy and hold security. It has returned -20% over the past year and -7% over the past two years. The environment is not the same as what it was in 2012 and 2013.

How did I make these calls?

Because returns in XIV are heavily dependent on the Weekly Roll Yield (WRY).

A major factor for the lower returns in the past two years comes from a smaller weekly roll yield that is used to propel XIV. The inverse of the XIV WRY is the VXX WRY (which comes from the difference between first and second month VIX futures). We track this important metric on our site, and as you can see in the graph below, the roll yield has moved from -2% to -1% over the past several years and has recently started to move toward 0%.


This is most important graph because the WRY serves as a headwind or tailwind to VIX ETPs. As the WRY approaches zero, trends become less stable and our advantage in trading XIV or VXX diminishes. Conversely, as the WRY moves away from zero trends become stronger.

Right now there is less of a headwind for VXX and less of a tailwind for XIV/SVXY. At this point in our old bull market we are also at high risk for the VXX WRY turning positive, which would give VXX a tailwind and XIV a headwind.

Revisiting our graph which compares the annual returns of XIV to the average Weekly Roll Yield (below), we can see why the WRY is so important.


Looking at the trendline we can see that with a fairly constant 1% WRY, we can generally expect XIV to return ~+25% per year. As the average WRY moves towards 2% we can expect XIV to return ~+120% per year.  At 0%, XIV is likely to return ~-60%. The recent shrinking of the WRY from 2% to 1% has an enormous impact on returns and that's why it is so important. A continued move of the WRY toward 0% or higher would be alarming to investors who plan to buy-and-hold XIV.

Because the WRY is such an important factor in the performance of VIX ETPs, our approach is to trade XIV and VXX using the WRY as a primary input for our VXX Bias and ZIV Bias indicators (our strategies are outlined here). While XIV is negative on the year, our VXX Bias indicator has put forth a performance of +33% YTD.

No credible trader will ever say that trading is easy, and that is doubly true when it comes to volatility. It requires a deep understanding of market forces, a solid process-oriented plan, and discipline in execution. In the current environment it will be more important than ever to stay on top of changing conditions.

We have been in the business of helping traders stay on top of the volatility market for three years now. We look forward to a fourth year of providing a variety of free data services throughout our website and are always happy to answer questions submitted through our Contact page. We also offer subscriber services to people looking for additional data, metrics, automated alerts and daily summaries, and access to a community of volatility traders. If you're interested, don't hesitate to drop us a line.


------------
Hypothetical and Simulated Performance Disclaimer
The results are based on simulated or hypothetical performance results that have certain inherent limitations. Unlike the results shown in an actual performance record, these results do not represent actual trading. Also, because these trades have not actually been executed, these results may have under- or over-compensated for the impact, if any, of certain market factors, such as lack of liquidity. Simulated or hypothetical trading programs in general are also subject to the fact that they are designed with the benefit of hindsight. No representation is being made that any account will or is likely to achieve profits or losses similar to these being shown. Additional performance differences in backtests arise from the methodology of using the 4:00pm ET closing values for XIV, VXX, and ZIV as approximated trade prices for indicators that require VIX and VIX futures to settle at 4:15pm ET.


. . . . . . . . . . . . . .

Stay up to date by having posts sent directly to your RSS feed or Email.

A Focus On Process Is Critical To A Trader's Long-Term Success

We are now eight months into 2015 and it's time to once again check in on YTD performance. The last three months have been difficult for the market and we saw a great example of why successful traders are process-oriented rather than results-oriented. So before we get to the scoreboard, let's look at the difference between the two.


Traders need data-driven, reliable, observable, and easy-to-follow trading rules in order to set themselves up for success. Talk to any successful professional and you'll get hear the common theme of process-orientation as one of the keys to success. I'll talk more about how this came into play later in this post.

Now, on to the scoreboard.

The S&P 500 and XIV ("short" volatility ETP) have suffered since our May update, with the S&P 500 -4.2% on the year and XIV now -18% through August. VXX ("long" volatility ETP) is in the same ballpark at -15% while ZIV ("short" medium-term volatility ETP) is -8%.

Fortunately we're not part of the buy-and-hold crowd and instead use our custom indicators to trade volatility ETPs on both the long and short sides (learn more about our strategies here).

Our indicators now sit at (year-to-date, through August):
  • VRP+VXX Bias: +40%
  • VXX Bias: +69%
  • VRP: -7%
  • ZIV Bias: -2%
Overall, our indicators actually lost ground since their peaks in June after facing some difficult market conditions from late-June to mid-August. The equity curve can be seen below.


While it can be frustrating to watch some of our gains disappear, this is where the process-orientation kicks in. We know that drawdowns happen in volatility trading, and when they do we refer to our flow chart from above.

Did we lose because we adhered to the trading rules?
Or did we lose because we broke the rules?

Even when you adhere to the rules, the "No big deal" attitude is tough to achieve when dealing with losers. This is especially true when they are back-to-back-to-back-to-back and result in multiple monthly losses. But while those short-term losses can feel painful, it's the long term that we care about. The pros continue to focus on the process of trading using proven indicators rather than short-term outcomes.

By looking specifically at monthly returns we can get a feel for how bad the past few months have been. First, the VRP+VXX Bias indicator had two consecutive months in June and July that were almost as bad as any on record, before recovering a bit in August. 


The next chart shows monthly performance for the VXX Bias indicator. Once again, June and July saw two of the worst consecutive months on record, with performance very similar to that of June/July 2011.

August, however, turned in the third best month ever, rewarding those able to keep trades mechanical and process-driven.

For those interested in additional details of the indicators, the daily history of indicator values that have been emailed to subscribers in 2015 can be found in the data sheet links below:
- VXX Bias: 2015
- VRP: 2015
- VRP+VXX Bias: 2015

If you're struggling to meet your investment objectives in this year's difficult market, perhaps we can help. For less than $3 per day we provide subscribers access to all of our VIX data & metrics, our indicators, automated change alerts, and the members' forum. 


______
Hypothetical and Simulated Performance Disclaimer
The results are based on simulated or hypothetical performance results that have certain inherent limitations. Unlike the results shown in an actual performance record, these results do not represent actual trading. Also, because these trades have not actually been executed, these results may have under- or over-compensated for the impact, if any, of certain market factors, such as lack of liquidity. Simulated or hypothetical trading programs in general are also subject to the fact that they are designed with the benefit of hindsight. No representation is being made that any account will or is likely to achieve profits or losses similar to these being shown. Additional performance differences in backtests arise from the methodology of using the 4:00pm ET closing values for XIV, VXX, and ZIV as approximated trade prices for indicators that require VIX and VIX futures to settle at 4:15pm ET.

. . . . . . . . . . . . . .

Stay up to date by having posts sent directly to your RSS feed or Email.

Our Indicator Performance: +71% YTD Through May

Inverse volatility ETFs continued their uptrend in May with XIV adding 13.4% during the month, bringing its year-to-date gains up to +45%. Here's a look at XIV's YTD chart:


A 45% gain in the first five months of the year is pretty good, but our indicators are all outperforming the buy-and-hold approach. Here is the performance of our indicators in 2015, through May 29th:
-  VXX Bias:             +69%
-  VRP:                    +60%
-  VRP+VXX Bias:     +71%

The equity curve for each strategy with comparison to XIV is shown in the following graph (the S&P 500 is +2.4% YTD and is not shown):


Trade statistics for each strategy are summarized as follows:


If you're not quite meeting your investment objectives this year perhaps we can help. For less than $3 per day we provide subscribers access to all of our VIX data & metrics, our indicators, automated change alerts, and the members' forum.

For those interested in additional detail, the daily history of indicator values that have been emailed to subscribers in 2015 can be found in the data sheet links below:
- VXX Bias: 2015
- VRP: 2015
- VRP+VXX Bias: 2015


______
Hypothetical and Simulated Performance Disclaimer
The results are based on simulated or hypothetical performance results that have certain inherent limitations. Unlike the results shown in an actual performance record, these results do not represent actual trading. Also, because these trades have not actually been executed, these results may have under- or over-compensated for the impact, if any, of certain market factors, such as lack of liquidity. Simulated or hypothetical trading programs in general are also subject to the fact that they are designed with the benefit of hindsight. No representation is being made that any account will or is likely to achieve profits or losses similar to these being shown. Additional performance differences in backtests arise from the methodology of using the 4:00pm ET closing values for XIV, VXX, and ZIV as approximated trade prices for indicators that require VIX and VIX futures to settle at 4:15pm ET.


. . . . . . . . . . . . . .

Stay up to date by having posts sent directly to your RSS feed or Email.

Our Indicator Performance +56% YTD Through April

April was a great month for inverse volatility ETFs and XIV in particular as it gained nearly 16% over the month to settle at +29% YTD. The trend was generally strong and without drama this month although it did give back some gains in the last week. XIV's one-month chart:


Our daily indicators rode this wave of gains throughout the month on only one trade, with the VXX Bias generating an XIV buy signal on 3-20-15 and our VRP indicator signalling a buy for XIV on 4-1-15.

This month's gains added to already impressive year-to-date returns for our indicators. Indicator performance through April:
-  VXX Bias: +51%,
-  VRP: +48%
-  VRP+VXX Bias: 56%.

The equity curves for each strategy with comparison to XIV are shown in the following graph (the S&P 500 is +1.4% YTD and is not shown):


Trade statistics for each strategy are summarized as follows:


For those interested in additional detail, the daily history of indicator values that have been emailed to subscribers in 2015 can be found in the data sheet links below:
- VXX Bias: 2015
- VRP: 2015
- VRP+VXX Bias: 2015


______
Hypothetical and Simulated Performance Disclaimer
The results are based on simulated or hypothetical performance results that have certain inherent limitations. Unlike the results shown in an actual performance record, these results do not represent actual trading. Also, because these trades have not actually been executed, these results may have under- or over-compensated for the impact, if any, of certain market factors, such as lack of liquidity. Simulated or hypothetical trading programs in general are also subject to the fact that they are designed with the benefit of hindsight. No representation is being made that any account will or is likely to achieve profits or losses similar to these being shown. Additional performance differences in backtests arise from the methodology of using the 4:00pm ET closing values for XIV, VXX, and ZIV as approximated trade prices for indicators that require VIX and VIX futures to settle at 4:15pm ET.


. . . . . . . . . . . . . .

Stay up to date by having posts sent directly to your RSS feed or Email.

Our VRP+VXX Bias Indicator +35% in 1st Quarter

The first quarter of 2015 has come to a close and investors everywhere are reviewing their performance. This is the perfect time to evaluate the effectiveness of your investment strategies and to make adjustments accordingly.

Our VXX Bias and VRP indicators have both navigated the first quarter quite well, at +31% and +29% YTD, respectively. These two indicators each provide end-of-day signals for placing swing trades in XIV and VXX (if you're not already familiar with our trading strategies you can learn more about them here). 

Our preferred strategy, VRP + VXX Bias, combines the two signals to place trades only when they agree on direction and is +35% YTD.

The graph below tracks the daily values for each of our indicators as well as XIV (buy-and-hold) as a comparison reference point (the usual investment benchmark, the S&P 500, is not included because it is an irrelevant +0.9% YTD).


We kept commission fees low by placing only a half dozen trades in the first quarter. Trade statistics for each strategy are summarized as follows**:


If you're not quite meeting your investment objectives this year perhaps we can help. For less than $3 per day we provide subscribers access to all of our VIX data & metrics, our indicators, automated Bias change alerts, and the members' forum.


--> New in 2015, we will be providing an additional level of visibility into our trading by having our performance verified by a third party (Marketfy). We recently tweeted our YTD portfolio performance of +17.8%, which was obtained by using the VRP+VXX Bias strategy as our guide. Look for additional updates on real-time notifications of our trades in the future.


**For those interested in additional detail, the daily history of indicator values that have been emailed to subscribers in 2015 can be found in the data sheet links below:
- VXX Bias: 2015
- VRP: 2015
- VRP+VXX Bias: 2015

______
Hypothetical and Simulated Performance Disclaimer
The results are based on simulated or hypothetical performance results that have certain inherent limitations. Unlike the results shown in an actual performance record, these results do not represent actual trading. Also, because these trades have not actually been executed, these results may have under- or over-compensated for the impact, if any, of certain market factors, such as lack of liquidity. Simulated or hypothetical trading programs in general are also subject to the fact that they are designed with the benefit of hindsight. No representation is being made that any account will or is likely to achieve profits or losses similar to these being shown. Additional performance differences in backtests arise from the methodology of using the 4:00pm ET closing values for XIV, VXX, and ZIV as approximated trade prices for indicators that require VIX and VIX futures to settle at 4:15pm ET.


. . . . . . . . . . . . . .

Stay up to date by having posts sent directly to your RSS feed or Email.

Utilizing Two Complementary Strategies to Trade VXX & XIV

In early December we made a second strategy for trading VXX and XIV available to our subscribers: the Volatility Risk Premium (VRP) strategy. You may remember me outlining the excellent performance of this strategy in my previous blog post, Volatility Strategies - Separating Fact From Fiction. I liked the strategy so much I decided to make a few adjustments and launch our own version of VRP to use along with our VXX Bias on our Daily Forecast page.

Why use two strategies for trading volatility ETPs? Because no single strategy is perfect and the market is inherently unpredictable. Using two complementary strategies simultaneously compensates for inherent weaknesses within each of the strategies, reduces drawdowns, and smooths out returns over months and years.


The VXX Bias and VRP strategies each take a very different approach for maximizing gains. The VXX Bias strategy is based on the term structure and momentum of VIX futures, while VRP is based on the price of VIX and historical volatility measurements. However, each of these strategies thrive and struggle depending on the specific market conditions. For example, the VXX Bias strategy has an advantage in handling periods of moderate drawdowns and sustained periods of backwardation. Meanwhile, the VRP strategy tends to be better with choppy markets and periods of gradually increasing volatility when VIX futures are in contango. 


You can see in the backtest results below that neither strategy consistently outperforms the other over a given year, although both VXX Bias and VRP are vastly superior to a buy-and-hold approach with XIV. 


As you can see in the chart above, using the VRP and VXX Bias strategies together (the green columns) provide more consistent returns than using just one strategy alone. In most years the "VRP + VXX Bias" strategy return falls roughly halfway between the VXX Bias and VRP strategies used on their own.  (Note: There are a couple ways to incorporate two strategies, but the easiest way is to trade in VXX or XIV only when they agree on the trade direction, which is how the above results are generated.)


Looking at the strategy statistics below, we see that the VRP + VXX Bias strategy benefits from a reduced maximum drawdown and a 0.90 Sharpe Ratio. 


Other relevant stats for trading only when VRP and VXX Bias agree on direction (years 2004-2014):

- # of trades: 191
- Avg hold time: 9.8 days
- # of days out of market in cash: 821 (out of 2711) --> 30%
- Avg trade return: 5.35%
- Max trade gain: 110.8%
- Max trade loss: -20.3%

The equity curve for each of the strategies (below) illustrates the smaller drawdowns and improved performance of using VRP and VXX Bias together:


Table of annual returns for the above data:


Full test data for both the VRP and VXX Bias strategies can be found in the spreadsheets at the bottom of the Subscribe page. You can also read more about our trading strategy on our Strategy page.

Access to our daily indicators and automated alerts for both the VRP and VXX Bias strategies is available via subscription to Trading Volatility+. 


------------
Hypothetical and Simulated Performance Disclaimer
The results are based on simulated or hypothetical performance results that have certain inherent limitations. Unlike the results shown in an actual performance record, these results do not represent actual trading. Also, because these trades have not actually been executed, these results may have under- or over-compensated for the impact, if any, of certain market factors, such as lack of liquidity. Simulated or hypothetical trading programs in general are also subject to the fact that they are designed with the benefit of hindsight. No representation is being made that any account will or is likely to achieve profits or losses similar to these being shown. Additional performance differences in backtests arise from the methodology of using the 4:00pm ET closing values for XIV, VXX, and ZIV as approximated trade prices for indicators that require VIX and VIX futures to settle at 4:15pm ET.


. . . . . . . . . . . . . .

Stay up to date by having posts sent directly to your RSS feed or Email.

2015 CBOE Risk Management Conference - Attendees get 30% off Subscription to Trading Volatility+

CBOE's Risk Management Conference is the premier educational forum for users of volatility products and equity derivatives. It is *the* conference for financial professionals to attend to learn the latest risk management tools and tactics from top traders and strategists. 

The next CBOE Risk Management Conference is scheduled for March 4-6 in Carlsbad, California. The agenda is now set with talks from over two dozen industry experts, exploring the latest products, trading strategies and tactics used to manage risk exposure and enhance yields. The full agenda is available here.

As an added bonus, attendees at the March 4-6, 2015 session are able to get a 30% discount* on their first three months of a Trading Volatility+ subscription. 

Our Trading Volatility+ service provides access to:
  • Our full suite of volatility metrics and indicators to bring you valuable insight into the movement of VIX ETPs, 
  • Our strategies, which utilize variations on widely-used trading indicators (such as Volatility Risk Premium) as well as our own proprietary algorithms (VXX BiasTM and ZIV BiasTM),
  • Our automated alerts which notify subscribers whenever one of our indicators experiences a critical change in direction, making the strategies easy to follow,
  • Our members' forum where you can interact and share ideas with other volatility traders. 
The unique characteristics and profit potential of VIX futures led to the fifth consecutive annual trading volume record in 2014. 2015 is already looking to break that record again as interest in volatility as a tradable asset continues to grow. If you're still shying away from this well-kept secret of sophisticated investors, now is is the time to learn more. A good place to start is with our concise (and FREE!) e-book, Fundamental Concepts and Strategies for Trading Volatility ETPs.


*Discount available only to new subscribers. The discount will be refunded to subscribers after providing proof of event attendance.


. . . . . . . . . . . . . .

Stay up to date by having posts sent directly to your RSS feed or Email.

Volatility Strategies - Separating Fact From Fiction

Earlier this year I came across the website Volatility Made Simple. Much like our goal at Trading Volatility, Volatility Made Simple's goal is to help less informed investors understand and take advantage volatility ETPs in a manner that is similar to how large institutions trade volatility.

What is really great about Volatility Made Simple, is that at the end of each month the performance of various volatility trading strategies is recorded. As of the November update there were twenty different strategies on the list, and according to him, they represent the vast majority of volatility trading strategies of traders timing these products.

Below is his image which illustrates the November performance of strategies compared to XIV buy-and-hold.


The other nice thing is that he will occasionally write posts which independently examine each strategy in depth, identifying the exact trading rules and performing backtests to 2004 to see how they perform under a variety of conditions. This is useful to make sure that a strategy is not just optimized for ideal markets but can also perform well in more turbulent environments. In addition he also provides statistics such as percent winning/losing trades, average trade return, and sometimes the max drawdown percentage and Sharpe ratios. Below I will post several of the charts from his site.

It gets interesting looking at the ten year returns of these strategies. Looking at VIX & More's (by Bill Luby) VIX:VXV ratio strategy, we can see that a portfolio of $10,000 in 2004 grows to a portfolio of over $1,200,000 by February 2014 when following these rules. Chart below:


From $10,000 to $1,200,000 -- that's a a 12,000% return in 10 years! That's remarkably impressive.

A similar strategy offered by Market Sci, the Mean Reversion Strategy, takes our portfolio of $10,000 in 2004 grows to a portfolio of over $1,200,000 as well, although it takes a slightly different path to get there. Chart for Market Sci's below:


Then there is Trading the Odds's Volatility Risk Premium strategy which boasts growth of $10,000 to over $5,000,000 (50,000% gain) over the same time frame, beating Market Sci's returns by a factor of five:


And if that return isn't enough, there's the Optimized VRP Strategy, which fine-tunes backtested performance to turn a portfolio of $10,000 to over $10,000,000 in 10 years. This strategy is achieved with an average of just eight trades per year. Chart below:


Wow. So should we be issuing a scam alert? A 100,000% return over 10 years?!? GET REAL!! Too good to be true, right?

Except that these strategies are all valid. The average investor who just buys index ETFs or scours the stock market looking for the hottest stocks in a struggle to outperform the S&P 500 (or just break even) will completely dismiss these returns as impossible. But for me, VIX and More, Market Sci, Trading The Odds, Volatility Made Simple, and all the other people who have developed one of these volatility strategies, these returns are real (Note: None of these people are aware that I'm writing this, they have no connection with the Trading Volatility site, and do not necessarily agree with or endorse anything I'm writing). 

How do I know that these ridiculous returns are likely to be legit without independently verifying them for myself? Because our VXX Bias strategy is right in the ballpark with the leaders (performance summary for our VXX Bias strategy can be found here).


When you look at the return over the entire period it seems astronomical. But actually this just demonstrates the power of compound interest. A portfolio of $10,000 that grows at 90% per year over 10 years is worth $6,131,066.26, which is roughly what the best strategies return. The trick is being able to average 90% per year while avoiding major drawdowns.

When I tell people about my strategy and the returns that can be achieved, everyone skeptically asks, "Why aren't other people doing this?" The answer is "THEY ARE!" 

Volatility Made Simple tracks a handful of strategies that have been made public. From what I can tell, and as VMS points out, most of the strategies apply similar concepts. Each strategy has its own strengths and weaknesses and many struggle through the same conditions. Because of certain optimizations, some strategies manage to excel over shorter time frames under certain conditions. However, over the years it's easier to see the order of magnitude of difference among the different strategies. I'd argue that a blend of two or three of the top strategies would be the best way to reduce variation in returns, however this may not be cost-effective for smaller accounts.

There are many other confidential volatility strategies out there. They belong to the smart money managers and institutions who are making money hand over fist. And the best part is that it doesn't matter if it is a bull or bear market. 2008 financial crisis? Not a problem -- in fact, a good strategy flips to buy volatility to take advantage of a steep market decline.

The fact is, volatility ETPs are generally giant scams designed to separate unknowing investors from their money. VXX and UVXY are obviously horrible over the long term but can go up 10x in a matter of months. Inverse volatility (XIV) looks good most of the time but is prone to 80%+ drawdowns that can wipe you out. People who understand how these products work can exploit their flaws to generate giant returns. 

For people trading volatility ETPs at a loss or barely getting by, you have a problem. Given the amount of free and paid resources out there, there's no excuse for this. Here are some things you may want to consider:

1) Find a signal-based trading plan that matches your style and fits in with your financial objectives. Make sure the strategy has signals that make it easy for you to follow.

2) Strictly trade based on hard rules. This will allow you to avoid making emotional decisions and fighting the trend, and will maximize long-term results.

3) Understand that day-to-day, week-to week, and month-to-month performance can result short-term negative returns. Don't lose focus of the long term.

4) You will have losing trades. This is why we focus on process and probabilities, not short-term outcomes. What matters is the process and patience.

5) If you are not able to follow rules, don't trade. Sorry to say, but if you can't find the discipline you don't get the profits (and you probably shouldn't be trading at all).


(It also helps to understand how VIX ETPs work. For an overview you can read my free eBook, Fundamental Concepts and Strategies for Trading Volatility ETPs.)

Most of the strategies on VMS's summary are similar in that they assess market conditions at the end of each trading day to determine if a buy or sell is necessary. They are also similar in the number of trades per year, typically between 7 and 30, making these strategies fairly manageable swing trades which do not require the investor to be glued to a trading screen all day.

When it comes down to it, I don't really care which strategy you choose as long as you are successful. It's just time to stop being one of the many unfortunate who are on the wrong side of the trade.

If you'd like more information on the Trading Volatility Bias strategy please visit this link. Our Bias indicators are automatically emailed at the end of each trading day and our Bias change alerts notify subscribers whenever the Bias changes direction, making it easy to follow. Our subscriber services are available for less than $3 per day making it very affordable.

You can also take advantage of our free VIX Futures Data pages as well as our SPY Arbitrage and Pivot Point tools. And if you have any questions at all, feel free to reach out to me via the Contact page.


------------
Hypothetical and Simulated Performance Disclaimer
The results are based on simulated or hypothetical performance results that have certain inherent limitations. Unlike the results shown in an actual performance record, these results do not represent actual trading. Also, because these trades have not actually been executed, these results may have under- or over-compensated for the impact, if any, of certain market factors, such as lack of liquidity. Simulated or hypothetical trading programs in general are also subject to the fact that they are designed with the benefit of hindsight. No representation is being made that any account will or is likely to achieve profits or losses similar to these being shown. Additional performance differences in backtests arise from the methodology of using the 4:00pm ET closing values for XIV, VXX, and ZIV as approximated trade prices for indicators that require VIX and VIX futures to settle at 4:15pm ET.


. . . . . . . . . . . . . .

Stay up to date by having posts sent directly to your RSS feed or Email.