Showing posts with label Collective2. Show all posts

Have You Become Part of the Buy-and-Hold Equity Herd?

What is your investing game plan?

Has the S&P 500's longest bull market in history, with its 336% gain, finally converted you to become a part of the buy-and-hold equity herd?

Do you think the U.S. equity market is now immune from the carnage we've seen recently in Emerging Markets (MSCI Emerging Market Index is now off 20% from the January highs)? Have you cast aside the idea of a balanced investment portfolio?

You probably don't want to even think about it, but this bull market will not last forever.1 There will be an equity bear market here in the U.S. Non-diversified investors risk facing losses similar to that of the 2000 dot com bust and the 2008 financial crisis. The trap is that we don't know when. Any perma-bears left are still taking on losses, ineptly sitting in cash, or getting crushed by cryptocurrencies.

I personally like an aggressive Modern Portfolio Theory portfolio with a heavy weighting on equities -- but with one important modification. I like to carve out a small portion of my portfolio and allocate it to process-driven volatility trading which is long volatility at times and short volatility at other times.

This is the concept of including volatility as an asset and there are right and wrong ways to do it.

 - Wrong way #1: Buy-and hold a short volatility ETP.
XIV, which was the short volatility ETP of choice, suffered a catastrophic hit in February 2018 and investors lost hundreds of millions of dollars. Prior to going bust, XIV was the "can't lose" fund that returned over 10x since inception in 2010. Many people lost nearly all of their investment and various professional money managers were fired because they didn't know what they were doing and ignored the trouble signs of the underlying assets (VIX Futures). The calamity was so bad, that some brokers banned the purchase of short volatility ETPs to try to protect the average investor (a bit late for that, don't you think??).

- Wrong way #2: Buy-and-hold a long volatility ETP.
If buy-and-hold of the short side of volatility is wrong, then it must be better to buy-and-hold long volatility ETPs, such as VXX? No. VXX and the 2x leveraged UVXY & TVIX ETPs suffer long term decay thanks largely due to the fact that these funds track VIX Futures that are most often in a state of contango. Without getting technical, it should be sufficient to point out that VXX has gone from over $100,000 (adjusted for multiple reverse splits) to $27 over the course of its lifespan since inception 9 years ago.

- The Right Way #1: Our VRP+VXX Bias indicators.
Our volatility indicators put us in cash, long volatility, or short volatility based on daily measurements of various components within the volatility market in order to provides us with a "flexible" fifth asset (the others being equities, bonds, real estate, and commodities). To take diversification one step further, our volatility trading indicators are comprised of multiple unrelated component indicators. No single indicator is perfect and ours are no exception. When they don't agree on what to do we move our volatility allocation to cash (this by the way, is how we survived the February volatility market imploded).

One really nice aspect of our VRP+VXX Bias algorithms, in addition to being fully automated, is that they get us invested in an asset that is non-correlated with other assets. This is key to good diversification within a portfolio. Why? Because if you are diversifying using an asset that has high correlation to another invested asset, you are diversifying in name only while both assets carry roughly the same performance.

The flip side of the non-correlated asset coin, however, is the fact that there will be times when our indicators lag the market. 2018 has been pitiful so far and this can be frustrating if you are not looking at the big picture. And that is, a properly diversified and properly balanced portfolio will excel long term.

At any given time there will be a lagging asset within a diversified portfolio. Smart investors don't just scrap an asset class after a bad month/year -- they rebalance and focus on their process knowing that the next year is likely to result in an entirely different outcome. Otherwise, the investor is left with a portfolio that carries less diversification, greater risk, and a lower long-term return potential.


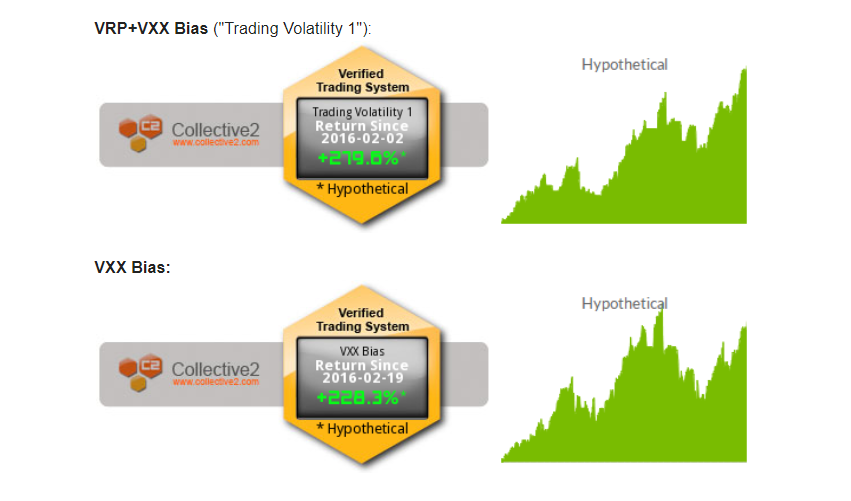
Our indicator's performance speaks for itself with actual automated signals and trades tracked by a third party since 2016, Collective2, here:


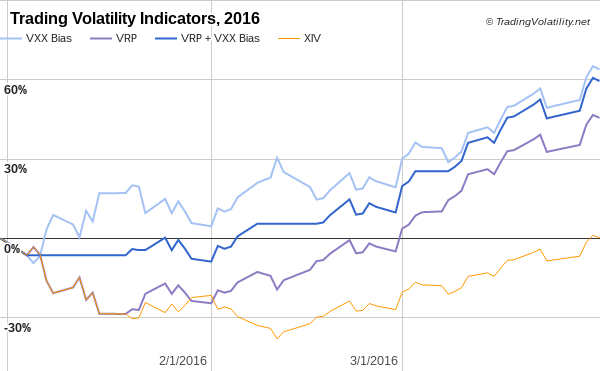
Looking further back using our modeling, we can see how VRP+VXX Bias ("Trading Volatility 1" performs in a variety of market conditions. By far, the best performing years for our indicators are when strong equity drawdowns occur, as can be seen in the chart below.


Trading Volatility+ subscribers have access to our VRP and VXX Bias indicators, our intraday indicator data, receive emails with preliminary and final change alerts for each of the indicators as well as our daily summaries, and interact with our private community of volatility traders in the forum. If interested, you can learn more about our services on our Subscribe page.

As always, each day's indicator values, buy/sell triggers, trade performance summary, and equity curves are tracked in the spreadsheets linked at the bottom of our Subscribe page. Additional information on our trading strategy and indicators can be found on our Strategy page.


Our indicators are also utilized by a volatility investment fund that is open only to accredited investors. If you think a managed volatility fund might better fit your needs please send a message through the Contact page.


Footnotes:
1 Smart people like to pretend they know why this bull market will end: the end of fiscal stimulus, rising interest rates, inflation, deflation, stagflation, global recession contagion, too much debt, high P/E ratios, trade wars, etc. No one knows the why or when and the average investor is unlikely to guess the when, and how it plays out, and be able to invest appropriately.

------------
Hypothetical and Simulated Performance Disclaimer
The results are based on simulated or hypothetical performance results that have certain inherent limitations. Unlike the results shown in an actual performance record, these results do not represent actual trading. Also, because these trades have not actually been executed, these results may have under- or over-compensated for the impact, if any, of certain market factors, such as lack of liquidity. Simulated or hypothetical trading programs in general are also subject to the fact that they are designed with the benefit of hindsight. No representation is being made that any account will or is likely to achieve profits or losses similar to these being shown. Hypothetical and backtest results do not account for any costs associated with trade commissions or subscription costs. Additional performance differences in backtests arise from the methodology of using the 4:00pm ET closing values for SVXY, VXX, and ZIV as approximated trade prices for indicators that require VIX and VIX futures to settle at 4:15pm ET


. . . . . . . . . . . . . .

Stay up to date by having posts sent directly to your RSS feed or Email.

Our 2017 Indicator Performance: +126%

We had a great 2016 with our primary indicator turning in a +96% gain, but 2017 was even better with a +126% gain. It was a bit of a wild journey, however, with a political headlines and threats of nuclear war popping up to cause some pretty strong drawdowns mid-year. Our equity curve for 2017 using hypothetical portfolios is as follows:


Below is how our indicators performed when we sent our trade orders through Collective2's auto-trading platform (performance values and graphs here date back to launch in February 2016), echoing the above equity curves.1

Both our VXX Bias and VRP+VXX Bias strategies were bested by a buy-and-hold approach with XIV in 2017 as it set a new record for best annual return. However, knowing that it is not a good idea to buy and hold XIV, I believe the VRP+VXX Bias performance was still rather good and it helped us to sell when it detected trouble coming our way.


Updated statistics:


Values for monthly returns have been tracked along the way and are updated on our Strategy page as well as below.


Trading Volatility+ subscribers have access to our VRP and VXX Bias indicators, our intraday indicator data, receive emails with preliminary and final change alerts for each of the indicators as well as our daily summaries, and interact with our private community of volatility traders in the forum. If interested, you can learn more about our services on our Subscribe page.

As always, each day's indicator values, buy/sell triggers, trade performance summary, and equity curves are tracked in the spreadsheets linked at the bottom of our Subscribe page. Additional information on our trading strategy and indicators can be found on our Strategy page.

1Note: As mentioned in our previous post, you will find differences between the ideal/hypothetical indicator performance and actual trading performance for the following reasons:
- The VRP+VXX Bias indicator ("Trading Volatility 1" on C2) was launched on C2 on Feb 2, 2016.
- The VXX Bias indicator was launched on C2 on Feb 19, 2016
- Both C2 systems traded only 72%-80% of portfolio equity until April 1. After April 1, both C2 systems trade at ~97.5% portfolio equity (the ideal/hypothetical model portfolios trade at 100% equity).
- The ideal/hypothetical performance does not account for trade commissions or subscriptions costs.

------------
Hypothetical and Simulated Performance Disclaimer
The results are based on simulated or hypothetical performance results that have certain inherent limitations. Unlike the results shown in an actual performance record, these results do not represent actual trading. Also, because these trades have not actually been executed, these results may have under- or over-compensated for the impact, if any, of certain market factors, such as lack of liquidity. Simulated or hypothetical trading programs in general are also subject to the fact that they are designed with the benefit of hindsight. No representation is being made that any account will or is likely to achieve profits or losses similar to these being shown. Hypothetical and backtest results do not account for any costs associated with trade commissions or subscription costs. Additional performance differences in backtests arise from the methodology of using the 4:00pm ET closing values for XIV, VXX, and ZIV as approximated trade prices for indicators that require VIX and VIX futures to settle at 4:15pm ET.


. . . . . . . . . . . . . .

Stay up to date by having posts sent directly to your RSS feed or Email.

YTD Performance of Our Volatility Indicator: +72.7%

While most people have been surprised to see volatility trend towards record lows in 2017, at Trading Volatility we have capitalized significantly on it.

The performance of our auto-traded "Trading Volatility 1" algorithm, which is executed and tracked by Collective2, is now at +72% year-to-date, nearly surpassing 2016's recorded return of (+75%).


Cumulatively, that's a 202% gain since we started tracking performance of our algorithm by a third party in February 2016.


The "Trading Volatility 1" system is the auto-traded version of our VRP+VXX Bias indicator which we have published daily to Trading Volatility+ subscribers for nearly five years now.

Trading Volatility+ subscribers have access to our VRP and VXX Bias indicators, our intraday indicator data, receive emails with preliminary and final change alerts for each of the indicators as well as our daily summaries, and interact with our private community of volatility traders in the forum. If interested, you can learn more about our services on our Subscribe page.

As always, each day's indicator values, buy/sell triggers, trade performance summary, and equity curves are tracked in the spreadsheets linked at the bottom of our Subscribe page. Additional information on our trading strategy and indicators can be found on our Strategy page.


Hypothetical and Simulated Performance Disclaimer
The results are based on simulated or hypothetical performance results that have certain inherent limitations. Unlike the results shown in an actual performance record, these results do not represent actual trading. Also, because these trades have not actually been executed, these results may have under- or over-compensated for the impact, if any, of certain market factors, such as lack of liquidity. Simulated or hypothetical trading programs in general are also subject to the fact that they are designed with the benefit of hindsight. No representation is being made that any account will or is likely to achieve profits or losses similar to these being shown. Hypothetical backtest results do not account for any costs associated with trade commissions or subscription costs. Additional performance differences in backtests arise from the methodology of using the 4:00pm ET closing values for XIV, VXX, and ZIV as approximated trade prices for indicators that require VIX and VIX futures to settle at 4:15pm ET


. . . . . . . . . . . . . .

Stay up to date by having posts sent directly to your RSS feed or Email.

Our Indicator Performance: +82% YTD Through November

It is time again for a year-to-date performance update of our indicators.

First, we have the hypothetical results using the daily indicators values in our model simulations (using ~100% equity on trades and assuming zero trade commissions). Here is the daily equity curve of all indicators, compared to XIV (buy-and-hold):

As you can see, the YTD performance of our indicators using hypothetical models has come down a bit since our update in July and subsequent peak on September 7th. Despite this lull, 2016 has been a very good year for us. Through November, the performance now sits at:
- VRP+VXX Bias: +82%
- VXX Bias: +122%
- VRP: +7%

For reference, 2016 performance of the publicly-traded "short volatility ETN" (ticker: XIV) and the "long volatility ETF" (ticker: VXX) are at:
- XIV (buy and hold): +69%
- VXX (buy and hold): -65%


Auto-Trade Performance on Collective2
We have tracked our actual trades and performance on Collective2's site since February 2016 (links: VRP+VXX Bias & VXX Bias). Our VRP+VXX Bias and VXX Bias indicators and both 100% automated algorithms which send signals to Collective2's platform for auto-trade execution in our trading account and performance tracking.1

From launch (February 2016) through November, performance on the auto-trade systems sit at:
- VRP+VXX Bias: +65%
- VXX Bias: +83%
- VRP: (not auto-traded)

As of last week, the current cumulative returns for our strategies auto-traded on Collective2 will be updated daily on our Strategy Page.

Compared to the indicators' historical record, 2016 is currently sitting around average for the year. Also posted on our Strategy Page, we have the monthly and annualized statistics for each of our strategies compared to XIV (buy-and-hold):


Trading Volatility+ subscribers have access to our VRP and VXX Bias indicators, our intraday indicator data, receive emails with preliminary and final change alerts for each of the indicators as well as our daily summaries, and interact with our private community of volatility traders in the forum. If interested, you can learn more about our services on our Subscribe page.

As always, each day's indicator values, buy/sell triggers, trade performance summary, and equity curves are tracked in the spreadsheets linked at the bottom of our Subscribe page. Additional information on our trading strategy and indicators can be found on our Strategy page.


1Note: As mentioned in our previous post, you will find differences between the ideal/hypothetical indicator performance and actual trading performance for the following reasons:
- The VRP+VXX Bias indicator ("Trading Volatility 1" on C2) was launched on C2 on Feb 2, 2016.
- The VXX Bias indicator was launched on C2 on Feb 19, 2016
- Both C2 systems traded only 72%-80% of portfolio equity until April 1. After April 1, both C2 systems trade at ~97.5% portfolio equity (the ideal/hypothetical model portfolios trade at 100% equity).
- The ideal/hypothetical performance does not account for trade commissions or subscriptions costs.

------------
Hypothetical and Simulated Performance Disclaimer
The results are based on simulated or hypothetical performance results that have certain inherent limitations. Unlike the results shown in an actual performance record, these results do not represent actual trading. Also, because these trades have not actually been executed, these results may have under- or over-compensated for the impact, if any, of certain market factors, such as lack of liquidity. Simulated or hypothetical trading programs in general are also subject to the fact that they are designed with the benefit of hindsight. No representation is being made that any account will or is likely to achieve profits or losses similar to these being shown. Hypothetical and backtest results do not account for any costs associated with trade commissions or subscription costs. Additional performance differences in backtests arise from the methodology of using the 4:00pm ET closing values for XIV, VXX, and ZIV as approximated trade prices for indicators that require VIX and VIX futures to settle at 4:15pm ET.


. . . . . . . . . . . . . .

Stay up to date by having posts sent directly to your RSS feed or Email.

Our Indicator Performance: +91% YTD Through July

With year-to-date performance numbers that look too good to be true, it's a good thing we started having our actual trades and performance tracked using Collective2's auto-trading capabilities earlier this year.

First, our indicator performance in 2016 (through July):
- VRP+VXX Bias: +91%
- VXX Bias: +142%
- VRP: +16%

Performance in 2016 of the "short volatility ETN" (ticker: XIV) and the "long volatility ETN" (ticker: VXX):
- XIV (buy and hold): +31%
- VXX (buy and hold): -49%

The daily equity curve of all indicators, compared to XIV (buy-and-hold):


Actual Trade Performance
Our VRP+VXX Bias and VXX Bias indicators and both 100% automated algorithms which send signals to Collective2's platform for auto-trade execution in our trading account (NOTE: we do not trade the standalone VRP strategy).

Our actual trades and performance can be found on Collective2's site (links: VRP+VXX Bias & VXX Bias). You will find differences between the ideal indicator performance (above) and actual trading performance for the following reasons:
- The VRP+VXX Bias indicator ("Trading Volatility 1" on C2) was launched on C2 on Feb 2, 2016.
- The VXX Bias indicator was launched on C2 on Feb 19, 2016
- Both C2 systems traded only 72%-80% of portfolio equity until April 1. After April 1, both C2 systems trade at ~97.5% portfolio equity (ideal indicator performance assumes ~100% use of equity).

Compared to the indicators' track record, 2016 has the potential to be an above average year. As posted on our Strategy Page, we have the annual statistics for each of our strategies compared to XIV (buy-and-hold):


We also now track our strategy statistics on a monthly timeframe:


One other observations is that trading has been less active than usual this year with only 7 trades so far for VRP+VXX Bias and 5 trades for VXX Bias.

All-in-all it's been a good year so far. It will be interesting to see how the rest of the year unfolds.


------------
Hypothetical and Simulated Performance Disclaimer
The results are based on simulated or hypothetical performance results that have certain inherent limitations. Unlike the results shown in an actual performance record, these results do not represent actual trading. Also, because these trades have not actually been executed, these results may have under- or over-compensated for the impact, if any, of certain market factors, such as lack of liquidity. Simulated or hypothetical trading programs in general are also subject to the fact that they are designed with the benefit of hindsight. No representation is being made that any account will or is likely to achieve profits or losses similar to these being shown. Additional performance differences in backtests arise from the methodology of using the 4:00pm ET closing values for XIV, VXX, and ZIV as approximated trade prices for indicators that require VIX and VIX futures to settle at 4:15pm ET.


. . . . . . . . . . . . . .

Stay up to date by having posts sent directly to your RSS feed or Email.

Our Indicator Performance: +59% In First Quarter Of 2016

I am proud to announce two of Trading Volatility's achievements for the first quarter of 2016. First, our indicators put in a rather impressive performance to kick off the year. We also launched automated trading for our VRP+VXX Bias and VXX Bias algorithms via Collective2's world-class platform.

First Quarter Indicator Results
The Trading Volatility indicators had a bit of a slow start in the first month of 2016 but rallied strong off of February's market low. Our VRP+VXX Bias indicator finished at +59% for the first quarter of 2016, while our VXX Bias came in at +64%. Our VRP indicator finished the quarter at +46%.

Below is the first quarter equity curve for the Trading Volatility indicators versus XIV (buy and hold):

For those interested in additional details of the indicators, the daily history of indicator values that have been emailed to subscribers in 2016 can be found in the data sheet links below:
- VXX Bias: 2016
- VRP: 2016
- VRP+VXX Bias: 2016


Launch of Auto-Trading
While I'm happy about the performance over the first quarter I'm even happier about the new option of auto-trading our indicators on Collective2's platform. As I announced a couple months ago, you can now have trades automatically placed in your brokerage account whenever the VRP+VXX Bias indicator changes. Since that post, we have added auto-trading for the VXX Bias indicator as well. Both strategies are available on Collective2 at an 85% discount for active Trading Volatility+ subscribers.

I have previously written that the key to successful investing is to have a solid plan as well as the discipline to be able to execute against it. Having our indicators automated does exactly that.

No more worrying about missing trades because I'm too busy.
No more emotional barriers making me wonder if I'm making the right decision to buy or sell.
No more distractions from the noise of daily market movements.
No more being tied to a trading screen all day.

The indicators now execute against the plan automatically and actual trades are tracked on Collective2's site at the following pages: VRP+VXX Bias indicator & VXX Bias indicator

Nothing changes for the existing Trading Volatility+ service. Subscribers will continue to have access to our intraday indicator data, receive emails with preliminary and final change alerts for each of the indicators as well as our daily summaries, and interact with our private community of volatility traders in the forum. If interested, you can learn more about our services on our Subscribe page.

As always, each day's indicator values, buy/sell triggers, trade performance summary, and equity curves are tracked in the spreadsheets linked at the bottom of our Subscribe page. Additional information on our trading strategy and indicators can be found on our Strategy page.


------------
Hypothetical and Simulated Performance Disclaimer
The results are based on simulated or hypothetical performance results that have certain inherent limitations. Unlike the results shown in an actual performance record, these results do not represent actual trading. Also, because these trades have not actually been executed, these results may have under- or over-compensated for the impact, if any, of certain market factors, such as lack of liquidity. Simulated or hypothetical trading programs in general are also subject to the fact that they are designed with the benefit of hindsight. No representation is being made that any account will or is likely to achieve profits or losses similar to these being shown. Additional performance differences in backtests arise from the methodology of using the 4:00pm ET closing values for XIV, VXX, and ZIV as approximated trade prices for indicators that require VIX and VIX futures to settle at 4:15pm ET.


. . . . . . . . . . . . . .

Stay up to date by having posts sent directly to your RSS feed or Email.

Automated Trading For Our VRP+VXX Bias Strategy

By popular request, we have made it dramatically easier for people to trade our leading indicator, the VRP+VXX Bias.

Our VRP+VXX Bias strategy, which returned 36% in 2015, is now available for auto-trading using Collective2's world-class automatic trading platform.

One of the biggest problems for traders and investors is discipline in execution. Scheduling conflicts, emotional barriers, trading fatigue, and lack of confidence can all lead to a deviation from proper trading plan execution. Automation is key in eliminating these common trading pitfalls.

This link is the new home of the VRP+VXX Bias strategy on the Collective2 website where you can follow the trading record, statistics, and a description of the product.

Auto-Trade At An 85% Discount**
Subscribers to our Trading Volatility+ service will receive an 85% discount on the C2 auto-trading service for as long as you remain a Trading Volatility+ subscriber (contact us for a coupon code).

7-Day Free Trial
Sign up at Collective2 for a 7-day free trial with no commitment and see what you think!

More Information On Collective2's Auto-Trading Platform
Collective2's auto-trading platform allows you to have the trades in our strategy mirrored in your own brokerage account. You control the brokerage firm, the trade size, and the ability to intervene to take profits or place your own stops. See here for additional information on their auto-trading and the list of compatible brokers.

Details On Our Automated Trading Plan
The trading execution on the C2 platform utilizes automated buy and sell signals from our VRP+VXX Bias indicator. The following are the detailed mechanics of this automated trading system:
- Trades will be placed at 3:57pm ET if our indicators detect a change in direction.
- Since our VRP+VXX Bias values become official at 4:33pm ET, any discrepancies with the official signal will be resolved at the open of the next trading session.
- This strategy is in 100% cash approximately 30% of the time.
- This strategy typically makes 20-30 trades per year.
- All VXX trades are entered with a 6% stop loss.
- All XIV trades are entered with a 10% stop loss.
- Additional data on our VRP+VXX Bias strategy can be found on our Strategy page.


** Promotional discount offerings subject to change without notice.


. . . . . . . . . . . . . .

Stay up to date by having posts sent directly to your RSS feed or Email.