Showing posts with label VRP+VXX Bias. Show all posts

Day Pass Memberships Now Available for $5

We understand that there are investors who don't have the need for a continuous monthly subscription. For some, the timing for buying and selling volatility ETFs is limited to particular moments where they see an opportunity arise and they are ready to make a trade. Other people just want to access to our set of volatility metrics on occasion when they perceive the market to be at a potential turning point.

I am pleased to announce that you can now purchase a Day Pass to Trading Volatility+ to gain full access to our members-only site at http://members.tradingvolatility.net/ on a non-recurring basis..

Day Passes will provide you with access to:
- The members' Daily Forecast page --  See the current day's indicators as well as the next day's indicators (after 4:33pm ET).
- The members' Intraday Indicators page -- View the indicator values as they update live during regular trading hours.
- Automated change alerts -- Receive an email if there is a buy/sell alert.

Day passes are available at our Subscribe page, with the option to purchase access for 1, 2, 3, 4, or 5 consecutive days (for which the market is open). Each Day Pass is valid from the time it is activated until 11:59pm ET.

Day Passes can be purchased for as low as $4/day**.

For those who may not be familiar with our services, we have offered subscribers a set of buy/sell indicators for volatility ETFs since 2013. Our superior returns were frequently hard to believe so we started having our performance tracked by a third party in 2016.


For more on how our indicators work and can be used, please see our Strategy page. Should you have any questions feel free to reach out to us via our Contact page.


**Pricing for day passes and monthly subscriptions is subject to change.

------------
Hypothetical and Simulated Performance Disclaimer
The results are based on simulated or hypothetical performance results that have certain inherent limitations. Unlike the results shown in an actual performance record, these results do not represent actual trading. Also, because these trades have not actually been executed, these results may have under- or over-compensated for the impact, if any, of certain market factors, such as lack of liquidity. Simulated or hypothetical trading programs in general are also subject to the fact that they are designed with the benefit of hindsight. No representation is being made that any account will or is likely to achieve profits or losses similar to these being shown. Backtest results do not account for any costs associated with trade commissions or subscription costs.  Additional performance differences in backtests arise from the methodology of using the 4:00pm ET closing values for SVXY,  VXX, and ZIV as approximated trade prices for indicators that require VIX and VIX futures to settle at 4:15pm ET.


. . . . . . . . . . . . . .

Stay up to date by having posts sent directly to your RSS feed or Email.

Our Indicators Performance Update - YTD Through July 2018

After a strong 2016 (+96%) and 2017 (+126%), our performance in 2018 has been rather lackluster so far.

The biggest difference between this year and previous years is that the short volatility trade isn't working well. We've generally seen small roll yields, choppy market conditions with strong whipsaw reversals, and a VIX that closed the first day of the year with a record low close of 9.77 (47% below the median close on the first day of the year). As you can see in the graph below, the short volatility trade (via buying SVXY) has generally contributed between plus and minus 10% to performance of both indicators all year.


The long volatility trades (via buying VXX) helped the performance for the VXX Bias with YTD returns briefly exceeding 100% after February's historical VIX spike. Despite the initial success however, both VRP+VXX Bias and VXX Bias indicators gave back most of their long volatility gains after February, as shown in the graph below.


Putting both the long and short volatility trades together for 2018 we arrive at the following YTD performance (through July):
  • VRP+VXX Bias: -19%
  • VXX Bias: +37%
  • VRP: -93%
  • SVXY (buy and hold): -89%

This year's journey can be viewed in the equity curves below:


As we did during 2016 and 2017, we continue to send our automated trade alerts to Collective2's auto-trading platform. Below is how our indicators performed, as tracked by Collective2 (performance values and graphs here date back to launch in February 2016).1


Overall, I've been very happy with how the indicators have performed since they were launched on our website back in 2013, but this year has certainly been slow so far -- especially over the last four months. 


As usual, I've updated the values for monthly returns and they have been updated on our Strategy page, as well as below.


Note: Trading Volatility+ subscribers have access to our VRP and VXX Bias indicators, our intraday indicator data, receive emails with preliminary and final change alerts for each of the indicators as well as our daily summaries, and interact with our private community of volatility traders in the forum. If interested, you can learn more about our services on our Subscribe page.

As always, each day's indicator values, buy/sell triggers, trade performance summary, and equity curves are tracked in the spreadsheets linked at the bottom of our Subscribe page. Additional information on our trading strategy and indicators can be found on our Strategy page.

1Note: As mentioned in our previous post, you will find differences between the ideal/hypothetical indicator performance and actual trading performance for the following reasons:
- The VRP+VXX Bias indicator ("Trading Volatility 1" on C2) was launched on C2 on Feb 2, 2016.
- The VXX Bias indicator was launched on C2 on Feb 19, 2016
- Both C2 systems traded only 72%-80% of portfolio equity until April 1. After April 1, both C2 systems trade at ~97.5% portfolio equity (the ideal/hypothetical model portfolios trade at 100% equity).
- The ideal/hypothetical performance does not account for trade commissions or subscriptions costs.

------------
Hypothetical and Simulated Performance Disclaimer
The results are based on simulated or hypothetical performance results that have certain inherent limitations. Unlike the results shown in an actual performance record, these results do not represent actual trading. Also, because these trades have not actually been executed, these results may have under- or over-compensated for the impact, if any, of certain market factors, such as lack of liquidity. Simulated or hypothetical trading programs in general are also subject to the fact that they are designed with the benefit of hindsight. No representation is being made that any account will or is likely to achieve profits or losses similar to these being shown. Hypothetical and backtest results do not account for any costs associated with trade commissions or subscription costs. Additional performance differences in backtests arise from the methodology of using the 4:00pm ET closing values for SVXY, VXX, and ZIV as approximated trade prices for indicators that require VIX and VIX futures to settle at 4:15pm ET.


. . . . . . . . . . . . . .

Stay up to date by having posts sent directly to your RSS feed or Email.

February YTD Performance of Our Volatility Indicator

2018 has gotten off to a wild start in the volatility world as volatility exploded higher in early February. The VIX Index recorded a new all-time 1-day gain of 115.6%, followed by a new all-time 1-day loss of -58% on the following day. This resulted in quite a bit of carnage, completely destroying XIV and causing large losses in SVXY.

Below are the equity curves of all strategies YTD 2018, compared to XIV (SVXY).


Our VRP+VXX Bias indicator has taken a hit, with a -6% return after the first two months of the year. The picture looks a little bit worse on Collective2 due to some platform execution errors.

VXX Bias outperformed with a buy of VXX in mid-January, reaching unrealized gains of over 100% YTD before giving quite a bit back to end February at +46%.

SVXY obviously took a hit and is -90% YTD. The standalone VRP strategy got caught holding SVXY/XIV and is tracking at -90% as well.


Cumulatively, VRP+VXX Bias has recorded a +201% gain since we started tracking performance by a third party in February 2016. Meanwhile VXX Bias had a large leap and is now +345% since launch on Collective2.


The "Trading Volatility 1" system is the auto-traded version of our VRP+VXX Bias indicator which we have published daily to Trading Volatility+ subscribers for nearly five years now.

Trading Volatility+ subscribers have access to our VRP and VXX Bias indicators, our intraday indicator data, receive emails with preliminary and final change alerts for each of the indicators as well as our daily summaries, and interact with our private community of volatility traders in the forum. If interested, you can learn more about our services on our Subscribe page.


As always, each day's indicator values, buy/sell triggers, trade performance summary, and equity curves are tracked in the spreadsheets linked at the bottom of our Subscribe page. 


Additional information on our trading strategy and indicators, including the updated monthly performance tables, can be found on our Strategy page.


===
Hypothetical and Simulated Performance Disclaimer
The results are based on simulated or hypothetical performance results that have certain inherent limitations. Unlike the results shown in an actual performance record, these results do not represent actual trading. Also, because these trades have not actually been executed, these results may have under- or over-compensated for the impact, if any, of certain market factors, such as lack of liquidity. Simulated or hypothetical trading programs in general are also subject to the fact that they are designed with the benefit of hindsight. No representation is being made that any account will or is likely to achieve profits or losses similar to these being shown. Hypothetical backtest results do not account for any costs associated with trade commissions or subscription costs. Additional performance differences in backtests arise from the methodology of using the 4:00pm ET closing values for XIV, VXX, and ZIV as approximated trade prices for indicators that require VIX and VIX futures to settle at 4:15pm ET


. . . . . . . . . . . . . .

Stay up to date by having posts sent directly to your RSS feed or Email.

Our 2017 Indicator Performance: +126%

We had a great 2016 with our primary indicator turning in a +96% gain, but 2017 was even better with a +126% gain. It was a bit of a wild journey, however, with a political headlines and threats of nuclear war popping up to cause some pretty strong drawdowns mid-year. Our equity curve for 2017 using hypothetical portfolios is as follows:


Below is how our indicators performed when we sent our trade orders through Collective2's auto-trading platform (performance values and graphs here date back to launch in February 2016), echoing the above equity curves.1

Both our VXX Bias and VRP+VXX Bias strategies were bested by a buy-and-hold approach with XIV in 2017 as it set a new record for best annual return. However, knowing that it is not a good idea to buy and hold XIV, I believe the VRP+VXX Bias performance was still rather good and it helped us to sell when it detected trouble coming our way.


Updated statistics:


Values for monthly returns have been tracked along the way and are updated on our Strategy page as well as below.


Trading Volatility+ subscribers have access to our VRP and VXX Bias indicators, our intraday indicator data, receive emails with preliminary and final change alerts for each of the indicators as well as our daily summaries, and interact with our private community of volatility traders in the forum. If interested, you can learn more about our services on our Subscribe page.

As always, each day's indicator values, buy/sell triggers, trade performance summary, and equity curves are tracked in the spreadsheets linked at the bottom of our Subscribe page. Additional information on our trading strategy and indicators can be found on our Strategy page.

1Note: As mentioned in our previous post, you will find differences between the ideal/hypothetical indicator performance and actual trading performance for the following reasons:
- The VRP+VXX Bias indicator ("Trading Volatility 1" on C2) was launched on C2 on Feb 2, 2016.
- The VXX Bias indicator was launched on C2 on Feb 19, 2016
- Both C2 systems traded only 72%-80% of portfolio equity until April 1. After April 1, both C2 systems trade at ~97.5% portfolio equity (the ideal/hypothetical model portfolios trade at 100% equity).
- The ideal/hypothetical performance does not account for trade commissions or subscriptions costs.

------------
Hypothetical and Simulated Performance Disclaimer
The results are based on simulated or hypothetical performance results that have certain inherent limitations. Unlike the results shown in an actual performance record, these results do not represent actual trading. Also, because these trades have not actually been executed, these results may have under- or over-compensated for the impact, if any, of certain market factors, such as lack of liquidity. Simulated or hypothetical trading programs in general are also subject to the fact that they are designed with the benefit of hindsight. No representation is being made that any account will or is likely to achieve profits or losses similar to these being shown. Hypothetical and backtest results do not account for any costs associated with trade commissions or subscription costs. Additional performance differences in backtests arise from the methodology of using the 4:00pm ET closing values for XIV, VXX, and ZIV as approximated trade prices for indicators that require VIX and VIX futures to settle at 4:15pm ET.


. . . . . . . . . . . . . .

Stay up to date by having posts sent directly to your RSS feed or Email.

Our 2016 Indicator Performance: +96%

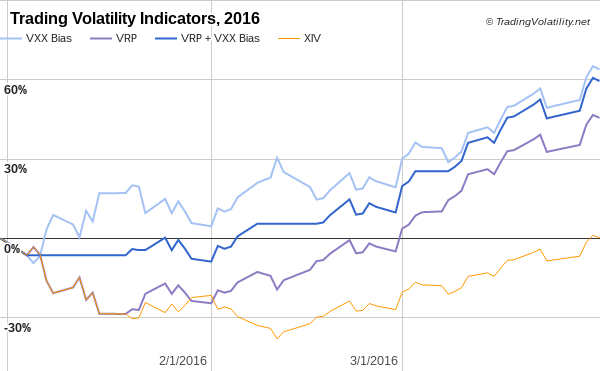
Our indicators had a really nice 2016, with our flagship VRP+VXX Bias indicator finishing +96% and our VXX Bias +149%.

The first quarter checkpoint of +59% set a great tone for the year while our July checkpoint of +91% YTD put us close to where we finished for the year after going through a volatile third quarter. Our equity curve for 2016 using a hypothetical portfolio is as follows:


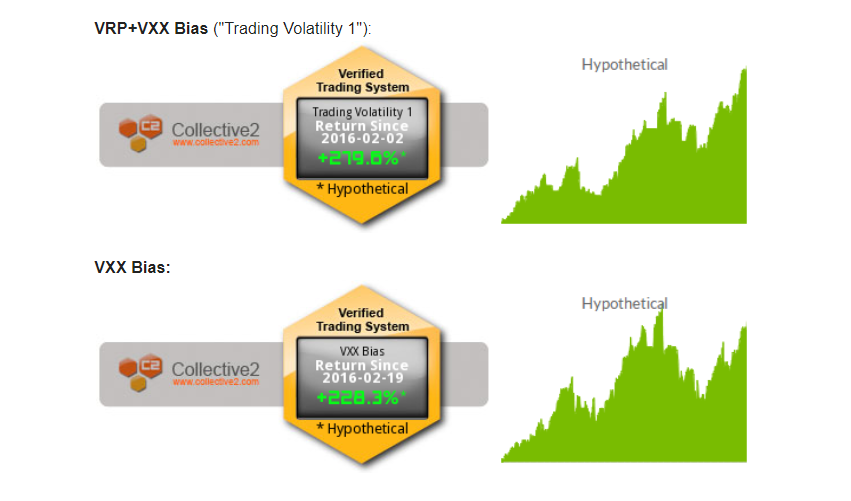
Below is how our indicators performed when we sent our trade orders through Collective2's auto-trading platform (since launch in February 2016), echoing the above equity curves.1


VRP+VXX Bias ("Trading Volatility 1")


VXX Bias:


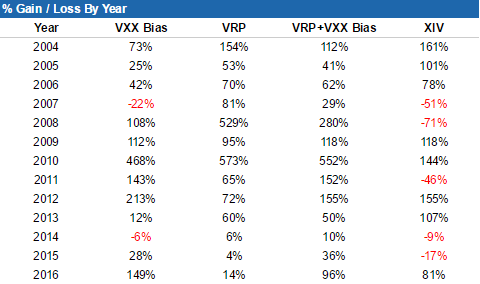
2016 will go down in the books as a below average for the VRP+VXX Bias strategy's +96%, while VXX Bias's +149% ranks in the top three among all backtest years.


Updated statistics:


Values for monthly returns have been tracked along the way and published on our Strategy page.

Trading Volatility+ subscribers have access to our VRP and VXX Bias indicators, our intraday indicator data, receive emails with preliminary and final change alerts for each of the indicators as well as our daily summaries, and interact with our private community of volatility traders in the forum. If interested, you can learn more about our services on our Subscribe page.

As always, each day's indicator values, buy/sell triggers, trade performance summary, and equity curves are tracked in the spreadsheets linked at the bottom of our Subscribe page. Additional information on our trading strategy and indicators can be found on our Strategy page.


1Note: As mentioned in our previous post, you will find differences between the ideal/hypothetical indicator performance and actual trading performance for the following reasons:
- The VRP+VXX Bias indicator ("Trading Volatility 1" on C2) was launched on C2 on Feb 2, 2016.
- The VXX Bias indicator was launched on C2 on Feb 19, 2016
- Both C2 systems traded only 72%-80% of portfolio equity until April 1. After April 1, both C2 systems trade at ~97.5% portfolio equity (the ideal/hypothetical model portfolios trade at 100% equity).
- The ideal/hypothetical performance does not account for trade commissions or subscriptions costs.


------------
Hypothetical and Simulated Performance Disclaimer
The results are based on simulated or hypothetical performance results that have certain inherent limitations. Unlike the results shown in an actual performance record, these results do not represent actual trading. Also, because these trades have not actually been executed, these results may have under- or over-compensated for the impact, if any, of certain market factors, such as lack of liquidity. Simulated or hypothetical trading programs in general are also subject to the fact that they are designed with the benefit of hindsight. No representation is being made that any account will or is likely to achieve profits or losses similar to these being shown. Hypothetical and backtest results do not account for any costs associated with trade commissions or subscription costs. Additional performance differences in backtests arise from the methodology of using the 4:00pm ET closing values for XIV, VXX, and ZIV as approximated trade prices for indicators that require VIX and VIX futures to settle at 4:15pm ET.


. . . . . . . . . . . . . .

Stay up to date by having posts sent directly to your RSS feed or Email.

Our Indicator Performance: +91% YTD Through July

With year-to-date performance numbers that look too good to be true, it's a good thing we started having our actual trades and performance tracked using Collective2's auto-trading capabilities earlier this year.

First, our indicator performance in 2016 (through July):
- VRP+VXX Bias: +91%
- VXX Bias: +142%
- VRP: +16%

Performance in 2016 of the "short volatility ETN" (ticker: XIV) and the "long volatility ETN" (ticker: VXX):
- XIV (buy and hold): +31%
- VXX (buy and hold): -49%

The daily equity curve of all indicators, compared to XIV (buy-and-hold):


Actual Trade Performance
Our VRP+VXX Bias and VXX Bias indicators and both 100% automated algorithms which send signals to Collective2's platform for auto-trade execution in our trading account (NOTE: we do not trade the standalone VRP strategy).

Our actual trades and performance can be found on Collective2's site (links: VRP+VXX Bias & VXX Bias). You will find differences between the ideal indicator performance (above) and actual trading performance for the following reasons:
- The VRP+VXX Bias indicator ("Trading Volatility 1" on C2) was launched on C2 on Feb 2, 2016.
- The VXX Bias indicator was launched on C2 on Feb 19, 2016
- Both C2 systems traded only 72%-80% of portfolio equity until April 1. After April 1, both C2 systems trade at ~97.5% portfolio equity (ideal indicator performance assumes ~100% use of equity).

Compared to the indicators' track record, 2016 has the potential to be an above average year. As posted on our Strategy Page, we have the annual statistics for each of our strategies compared to XIV (buy-and-hold):


We also now track our strategy statistics on a monthly timeframe:


One other observations is that trading has been less active than usual this year with only 7 trades so far for VRP+VXX Bias and 5 trades for VXX Bias.

All-in-all it's been a good year so far. It will be interesting to see how the rest of the year unfolds.


------------
Hypothetical and Simulated Performance Disclaimer
The results are based on simulated or hypothetical performance results that have certain inherent limitations. Unlike the results shown in an actual performance record, these results do not represent actual trading. Also, because these trades have not actually been executed, these results may have under- or over-compensated for the impact, if any, of certain market factors, such as lack of liquidity. Simulated or hypothetical trading programs in general are also subject to the fact that they are designed with the benefit of hindsight. No representation is being made that any account will or is likely to achieve profits or losses similar to these being shown. Additional performance differences in backtests arise from the methodology of using the 4:00pm ET closing values for XIV, VXX, and ZIV as approximated trade prices for indicators that require VIX and VIX futures to settle at 4:15pm ET.


. . . . . . . . . . . . . .

Stay up to date by having posts sent directly to your RSS feed or Email.

Our Indicator Performance: +59% In First Quarter Of 2016

I am proud to announce two of Trading Volatility's achievements for the first quarter of 2016. First, our indicators put in a rather impressive performance to kick off the year. We also launched automated trading for our VRP+VXX Bias and VXX Bias algorithms via Collective2's world-class platform.

First Quarter Indicator Results
The Trading Volatility indicators had a bit of a slow start in the first month of 2016 but rallied strong off of February's market low. Our VRP+VXX Bias indicator finished at +59% for the first quarter of 2016, while our VXX Bias came in at +64%. Our VRP indicator finished the quarter at +46%.

Below is the first quarter equity curve for the Trading Volatility indicators versus XIV (buy and hold):

For those interested in additional details of the indicators, the daily history of indicator values that have been emailed to subscribers in 2016 can be found in the data sheet links below:
- VXX Bias: 2016
- VRP: 2016
- VRP+VXX Bias: 2016


Launch of Auto-Trading
While I'm happy about the performance over the first quarter I'm even happier about the new option of auto-trading our indicators on Collective2's platform. As I announced a couple months ago, you can now have trades automatically placed in your brokerage account whenever the VRP+VXX Bias indicator changes. Since that post, we have added auto-trading for the VXX Bias indicator as well. Both strategies are available on Collective2 at an 85% discount for active Trading Volatility+ subscribers.

I have previously written that the key to successful investing is to have a solid plan as well as the discipline to be able to execute against it. Having our indicators automated does exactly that.

No more worrying about missing trades because I'm too busy.
No more emotional barriers making me wonder if I'm making the right decision to buy or sell.
No more distractions from the noise of daily market movements.
No more being tied to a trading screen all day.

The indicators now execute against the plan automatically and actual trades are tracked on Collective2's site at the following pages: VRP+VXX Bias indicator & VXX Bias indicator

Nothing changes for the existing Trading Volatility+ service. Subscribers will continue to have access to our intraday indicator data, receive emails with preliminary and final change alerts for each of the indicators as well as our daily summaries, and interact with our private community of volatility traders in the forum. If interested, you can learn more about our services on our Subscribe page.

As always, each day's indicator values, buy/sell triggers, trade performance summary, and equity curves are tracked in the spreadsheets linked at the bottom of our Subscribe page. Additional information on our trading strategy and indicators can be found on our Strategy page.


------------
Hypothetical and Simulated Performance Disclaimer
The results are based on simulated or hypothetical performance results that have certain inherent limitations. Unlike the results shown in an actual performance record, these results do not represent actual trading. Also, because these trades have not actually been executed, these results may have under- or over-compensated for the impact, if any, of certain market factors, such as lack of liquidity. Simulated or hypothetical trading programs in general are also subject to the fact that they are designed with the benefit of hindsight. No representation is being made that any account will or is likely to achieve profits or losses similar to these being shown. Additional performance differences in backtests arise from the methodology of using the 4:00pm ET closing values for XIV, VXX, and ZIV as approximated trade prices for indicators that require VIX and VIX futures to settle at 4:15pm ET.


. . . . . . . . . . . . . .

Stay up to date by having posts sent directly to your RSS feed or Email.

Our 2015 Indicator Performance: +36%

2015 was a difficult year in the investing world. As it turns out, one of the best performing assets last year was cash since most other asset classes lost money.

According to CNBC, 2015 was the hardest year to make money in 78 years. Investment legends struggled with David Einhorn's Greenlight Capital and Bill Ackman's Pershing Square fund both losing 20%, while average hedge fund performance did not breakeven. In the process, 31 hedge funds shut down during 2015.

It is against this backdrop that we highlight our own struggle in 2015: +36% for our primary indicator (the VRP+VXX Bias).

The end results were respectable, but getting there was anything but easy. The second half of the year was fairly stressful and a bit disappointing given that it was +77% in June. The 2015 equity curve for each of our indicators for trading XIV & VXX, along with XIV's performance, is shown in the following graph.


Drawdowns were painful with VXX Bias experiencing a 43% drawdown in August, fully recovering and hitting a new peak of +94% YTD on September 1st, only to be followed by a 40% drawdown in October. VRP+VXX Bias strategy also experienced a 40% drawdown in the second half of the year and was not able to recapture its +77% high from June before year end.

For the more experienced traders these drawdowns were rather unpleasant. For the uninitiated, the drawdowns were probably enough to make them call it quits. But in the end, it was another year of outperforming just about everything by a large margin with only a couple dozen trades.

In order to compare our results to other known volatility strategies I've included Volatility Made Simple's 2015 performance graph for 24 strategies, below.  Only the VIX vs VXV strategy outperformed our VRP+VXX Bias in 2015, but that strategy's long-term performance remains comparatively poor and suffers from inconsistency (57.6% avg annual return, 0.93 Sharpe ratio, and 70.6% max drawdown).


ZIV Bias Indicator
At -2%, ZIV (the medium-term VIX Futures inverse fund) once again outperformed XIV, which came in at -17% for 2015. While the ZIV Bias indicator was successful in its goal of keeping traders in cash and out of August's major drawdown, it faltered a bit during the choppy trading at the very beginning and end of the year. Ultimately, the ZIV Bias indicator underperformed buy-and-hold this year with a -9%.


As always, each day's indicator values, buy/sell triggers, trade performance summary, and equity curves are tracked in the spreadsheets linked at the bottom of our Subscribe page. Additional information on our trading strategy and indicators can be found on our Strategy page.

Trading Volatility+ subscribers have the benefit of seeing our intraday indicator data, receiving emails with preliminary and final change alerts for each of the indicators as well as our daily summaries, and interacting with our private community of volatility traders in the forum. If interested, you can learn more about our services on our Subscribe page.

2016 is already shaping up to be another exciting year for Trading Volatility. We'd love to have you join us in taking on this difficult market!


------------
Hypothetical and Simulated Performance Disclaimer
The results are based on simulated or hypothetical performance results that have certain inherent limitations. Unlike the results shown in an actual performance record, these results do not represent actual trading. Also, because these trades have not actually been executed, these results may have under- or over-compensated for the impact, if any, of certain market factors, such as lack of liquidity. Simulated or hypothetical trading programs in general are also subject to the fact that they are designed with the benefit of hindsight. No representation is being made that any account will or is likely to achieve profits or losses similar to these being shown. Additional performance differences in backtests arise from the methodology of using the 4:00pm ET closing values for XIV, VXX, and ZIV as approximated trade prices for indicators that require VIX and VIX futures to settle at 4:15pm ET.


. . . . . . . . . . . . . .

Stay up to date by having posts sent directly to your RSS feed or Email.

A Focus On Process Is Critical To A Trader's Long-Term Success

We are now eight months into 2015 and it's time to once again check in on YTD performance. The last three months have been difficult for the market and we saw a great example of why successful traders are process-oriented rather than results-oriented. So before we get to the scoreboard, let's look at the difference between the two.


Traders need data-driven, reliable, observable, and easy-to-follow trading rules in order to set themselves up for success. Talk to any successful professional and you'll get hear the common theme of process-orientation as one of the keys to success. I'll talk more about how this came into play later in this post.

Now, on to the scoreboard.

The S&P 500 and XIV ("short" volatility ETP) have suffered since our May update, with the S&P 500 -4.2% on the year and XIV now -18% through August. VXX ("long" volatility ETP) is in the same ballpark at -15% while ZIV ("short" medium-term volatility ETP) is -8%.

Fortunately we're not part of the buy-and-hold crowd and instead use our custom indicators to trade volatility ETPs on both the long and short sides (learn more about our strategies here).

Our indicators now sit at (year-to-date, through August):
  • VRP+VXX Bias: +40%
  • VXX Bias: +69%
  • VRP: -7%
  • ZIV Bias: -2%
Overall, our indicators actually lost ground since their peaks in June after facing some difficult market conditions from late-June to mid-August. The equity curve can be seen below.


While it can be frustrating to watch some of our gains disappear, this is where the process-orientation kicks in. We know that drawdowns happen in volatility trading, and when they do we refer to our flow chart from above.

Did we lose because we adhered to the trading rules?
Or did we lose because we broke the rules?

Even when you adhere to the rules, the "No big deal" attitude is tough to achieve when dealing with losers. This is especially true when they are back-to-back-to-back-to-back and result in multiple monthly losses. But while those short-term losses can feel painful, it's the long term that we care about. The pros continue to focus on the process of trading using proven indicators rather than short-term outcomes.

By looking specifically at monthly returns we can get a feel for how bad the past few months have been. First, the VRP+VXX Bias indicator had two consecutive months in June and July that were almost as bad as any on record, before recovering a bit in August. 


The next chart shows monthly performance for the VXX Bias indicator. Once again, June and July saw two of the worst consecutive months on record, with performance very similar to that of June/July 2011.

August, however, turned in the third best month ever, rewarding those able to keep trades mechanical and process-driven.

For those interested in additional details of the indicators, the daily history of indicator values that have been emailed to subscribers in 2015 can be found in the data sheet links below:
- VXX Bias: 2015
- VRP: 2015
- VRP+VXX Bias: 2015

If you're struggling to meet your investment objectives in this year's difficult market, perhaps we can help. For less than $3 per day we provide subscribers access to all of our VIX data & metrics, our indicators, automated change alerts, and the members' forum. 


______
Hypothetical and Simulated Performance Disclaimer
The results are based on simulated or hypothetical performance results that have certain inherent limitations. Unlike the results shown in an actual performance record, these results do not represent actual trading. Also, because these trades have not actually been executed, these results may have under- or over-compensated for the impact, if any, of certain market factors, such as lack of liquidity. Simulated or hypothetical trading programs in general are also subject to the fact that they are designed with the benefit of hindsight. No representation is being made that any account will or is likely to achieve profits or losses similar to these being shown. Additional performance differences in backtests arise from the methodology of using the 4:00pm ET closing values for XIV, VXX, and ZIV as approximated trade prices for indicators that require VIX and VIX futures to settle at 4:15pm ET.


. . . . . . . . . . . . . .

Stay up to date by having posts sent directly to your RSS feed or Email.

Our Indicator Performance: +71% YTD Through May

Inverse volatility ETFs continued their uptrend in May with XIV adding 13.4% during the month, bringing its year-to-date gains up to +45%. Here's a look at XIV's YTD chart:


A 45% gain in the first five months of the year is pretty good, but our indicators are all outperforming the buy-and-hold approach. Here is the performance of our indicators in 2015, through May 29th:
-  VXX Bias:             +69%
-  VRP:                    +60%
-  VRP+VXX Bias:     +71%

The equity curve for each strategy with comparison to XIV is shown in the following graph (the S&P 500 is +2.4% YTD and is not shown):


Trade statistics for each strategy are summarized as follows:


If you're not quite meeting your investment objectives this year perhaps we can help. For less than $3 per day we provide subscribers access to all of our VIX data & metrics, our indicators, automated change alerts, and the members' forum.

For those interested in additional detail, the daily history of indicator values that have been emailed to subscribers in 2015 can be found in the data sheet links below:
- VXX Bias: 2015
- VRP: 2015
- VRP+VXX Bias: 2015


______
Hypothetical and Simulated Performance Disclaimer
The results are based on simulated or hypothetical performance results that have certain inherent limitations. Unlike the results shown in an actual performance record, these results do not represent actual trading. Also, because these trades have not actually been executed, these results may have under- or over-compensated for the impact, if any, of certain market factors, such as lack of liquidity. Simulated or hypothetical trading programs in general are also subject to the fact that they are designed with the benefit of hindsight. No representation is being made that any account will or is likely to achieve profits or losses similar to these being shown. Additional performance differences in backtests arise from the methodology of using the 4:00pm ET closing values for XIV, VXX, and ZIV as approximated trade prices for indicators that require VIX and VIX futures to settle at 4:15pm ET.


. . . . . . . . . . . . . .

Stay up to date by having posts sent directly to your RSS feed or Email.

Our Indicator Performance +56% YTD Through April

April was a great month for inverse volatility ETFs and XIV in particular as it gained nearly 16% over the month to settle at +29% YTD. The trend was generally strong and without drama this month although it did give back some gains in the last week. XIV's one-month chart:


Our daily indicators rode this wave of gains throughout the month on only one trade, with the VXX Bias generating an XIV buy signal on 3-20-15 and our VRP indicator signalling a buy for XIV on 4-1-15.

This month's gains added to already impressive year-to-date returns for our indicators. Indicator performance through April:
-  VXX Bias: +51%,
-  VRP: +48%
-  VRP+VXX Bias: 56%.

The equity curves for each strategy with comparison to XIV are shown in the following graph (the S&P 500 is +1.4% YTD and is not shown):


Trade statistics for each strategy are summarized as follows:


For those interested in additional detail, the daily history of indicator values that have been emailed to subscribers in 2015 can be found in the data sheet links below:
- VXX Bias: 2015
- VRP: 2015
- VRP+VXX Bias: 2015


______
Hypothetical and Simulated Performance Disclaimer
The results are based on simulated or hypothetical performance results that have certain inherent limitations. Unlike the results shown in an actual performance record, these results do not represent actual trading. Also, because these trades have not actually been executed, these results may have under- or over-compensated for the impact, if any, of certain market factors, such as lack of liquidity. Simulated or hypothetical trading programs in general are also subject to the fact that they are designed with the benefit of hindsight. No representation is being made that any account will or is likely to achieve profits or losses similar to these being shown. Additional performance differences in backtests arise from the methodology of using the 4:00pm ET closing values for XIV, VXX, and ZIV as approximated trade prices for indicators that require VIX and VIX futures to settle at 4:15pm ET.


. . . . . . . . . . . . . .

Stay up to date by having posts sent directly to your RSS feed or Email.

Our VRP+VXX Bias Indicator +35% in 1st Quarter

The first quarter of 2015 has come to a close and investors everywhere are reviewing their performance. This is the perfect time to evaluate the effectiveness of your investment strategies and to make adjustments accordingly.

Our VXX Bias and VRP indicators have both navigated the first quarter quite well, at +31% and +29% YTD, respectively. These two indicators each provide end-of-day signals for placing swing trades in XIV and VXX (if you're not already familiar with our trading strategies you can learn more about them here). 

Our preferred strategy, VRP + VXX Bias, combines the two signals to place trades only when they agree on direction and is +35% YTD.

The graph below tracks the daily values for each of our indicators as well as XIV (buy-and-hold) as a comparison reference point (the usual investment benchmark, the S&P 500, is not included because it is an irrelevant +0.9% YTD).


We kept commission fees low by placing only a half dozen trades in the first quarter. Trade statistics for each strategy are summarized as follows**:


If you're not quite meeting your investment objectives this year perhaps we can help. For less than $3 per day we provide subscribers access to all of our VIX data & metrics, our indicators, automated Bias change alerts, and the members' forum.


--> New in 2015, we will be providing an additional level of visibility into our trading by having our performance verified by a third party (Marketfy). We recently tweeted our YTD portfolio performance of +17.8%, which was obtained by using the VRP+VXX Bias strategy as our guide. Look for additional updates on real-time notifications of our trades in the future.


**For those interested in additional detail, the daily history of indicator values that have been emailed to subscribers in 2015 can be found in the data sheet links below:
- VXX Bias: 2015
- VRP: 2015
- VRP+VXX Bias: 2015

______
Hypothetical and Simulated Performance Disclaimer
The results are based on simulated or hypothetical performance results that have certain inherent limitations. Unlike the results shown in an actual performance record, these results do not represent actual trading. Also, because these trades have not actually been executed, these results may have under- or over-compensated for the impact, if any, of certain market factors, such as lack of liquidity. Simulated or hypothetical trading programs in general are also subject to the fact that they are designed with the benefit of hindsight. No representation is being made that any account will or is likely to achieve profits or losses similar to these being shown. Additional performance differences in backtests arise from the methodology of using the 4:00pm ET closing values for XIV, VXX, and ZIV as approximated trade prices for indicators that require VIX and VIX futures to settle at 4:15pm ET.


. . . . . . . . . . . . . .

Stay up to date by having posts sent directly to your RSS feed or Email.