I provide quite a bit of essential data for trading volatility ETPs on the VIX Futures Data page, but if you are unfamiliar with the various VIX metrics it can be difficult to know where to look and how to interpret that information.
For me, the numbers on the page are critical since I look at them at the close of each day to determine whether I want to buy, sell, or hold various VIX ETFs. Since I often receive questions about whether it is time to be long/short XIV/VXX/UVXY, I decided to share a daily forecast tool for VXX which essentially summarizes my opinions on the direction of VXX for the next day of trading.
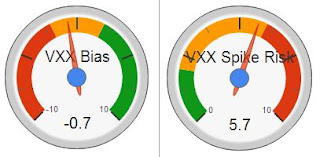
There are two components to this forecast, as illustrated by the gauges on the Daily Forecast page.
1) VXX Bias
This gauge measures the bias of VXX and is largely determined by the roll yield (more on the roll yield in this post), which can be conceptualized as a headwind or tailwind. The gauge values are on a linear scale from -10 to +10, with a more negative reading indicating a stronger negative bias (headwind), and a more positive reading indicating a stronger positive bias (tailwind). Note that the gauge's range covers +3 and -3 standard deviations from the past 9 years of data for a total of 6σ.
2) VXX Spike Risk
The second forecast gauge reflects the likelihood of a significant spike in VXX. It takes data from the term structure of the front two months of VIX futures, the premium of front month futures over (or under) spot VIX, and recent moves in spot VIX. The gauge output is a scale of 0 to 10, with 0 being the lowest risk of a VXX spike, and 10 being the highest risk of a VXX spike.
Using the Gauges
Shorting VXX (or being long XIV) has been an excellent trade over the past several years due to a persistent state of contango in the VIX futures term structure. Simply being short VXX when there is a negative bias and long VXX when there is a positive bias has resulted in an average return of 116% per year over the past three years. The VXX Bias gauge will tell you which side of the trade you want to be on. Values toward the middle, and specifically in the yellow zone, mean that the term structure is relatively flat and you won't get much benefit from the roll yield with either a long or short position. It's important to note that while the bias gauge provides insight on the headwind/tailwind that VXX faces, VXX can still move up with a negative bias or down with a positive bias if the underlying futures move enough.
When you are short VXX it is always important to know what the risk is of the trade moving against you. While VXX loosely follows the daily action of the VIX, future VXX performance can be determined by the shape of the term structure in the 1st two months of VIX futures, and the value of these futures in relation to spot VIX. The readings on the gauge will spend a majority of time in the yellow region, signifying a medium risk of a spike. A move into the upper range of the yellow and red will make me increasingly nervous to be short VXX or long XIV.
Of course there are market/world events which will cause the VIX and VXX to spike dramatically. While this model cannot predict the unexpected, it does provide the ability to detect shifts in investor sentiment of known macro risks.
Below are some examples of what the gauge look like under various conditions (it might be helpful to look at the charts for VXX/XIV to see what price was doing during these times).
First is a series of five dates showing the period from late July/early August as the term structure flipped from contango to backwardation (some days omitted due to lack of substantial difference).
_________________________________
July 21, 2011
M1-M2: -1.65
M1 to VIX: 4%
VXX: $83.52
_________________________________
July 26, 2011
M1-M2: -1.15
M1 to VIX: -3%
VXX: $88.00
_________________________________
July 27, 2011
M1-M2: -0.40
M1 to VIX: -7%
VXX: $93.20
_________________________________
July 29, 2011
M1-M2: 0
M1 to VIX: -16%
VXX: $93.64
_________________________________
Aug 5, 2011
M1-M2: +2.95
M1 to VIX: -9%
VXX: $121.24
_________________________________________________
The next pair show a period of contango with a very high premium of M1 to VIX
_________________________________
Feb 17, 2012
M1-M2: -2.15
M1 to VIX: +27%
_________________________________________________
Lastly, a view of a very large contango spread:
_________________________________
March 16, 2012
M1-M2: -5.45
M1 to VIX: +12%
New Tool Available: VXX Daily Forecast
By
Jay Wolberg
Posted on:
4/01/2013 10:15:00 AM


