Today I'm excited to announce that we've updated the strategy to reduce the amount of signal noise by utilizing exponential moving averages. The result is 30% fewer trades and substantially improved performance in our backtested performance. The new chart will be published daily at the same location on the VIX Futures Data page.
The original WRY-10SMA chart looked like this:
In the new methodology which utilizes the 5EMA and 8EMA of the VXX WRY, the chart looks like this:
As you can see it is a very similar graph, but the WRY moving average lines (blue and purple) are smoother to reduce false signals and choppy trading.
Since we only care about whether the 5EMA is above or below the 8EMA, we've taken the update one step further to help simplify the chart and make it easier to identify when the lines cross. We replaced the two EMA lines with one line, by taking 5EMA minus 8EMA (Note: This is essentially a variant on the standard MACD calculation). Left axis is the MACD signal, while the right axis is VXX price.
Trading Strategy
A positive WRY MACD crossover indicates short-term upward momentum acting on VXX. A negative WRY MACD crossover indicates indicates short-term downward momentum acting on VXX. Therefore, the strategy is to be short VXX (or long XIV/SVXY) when the MACD value is negative, and long VXX when the MACD is positive. The best results in a hypothetical portfolio are obtained by using the WRY MACD indicator along with our Bias forecasts to trade in the same direction of a VIX ETPs current bias. As noted in the announcement of the original version of this strategy (WRY-10SMA), gains from being long VXX when the bias is negative will tend to disappear quickly and sometimes turn into losses so it is usually best to take gains early and/or set trailing stops. Similarly, being short VXX when its Bias is positive and MACD is negative will not produce consistently good results.
Performance Testing
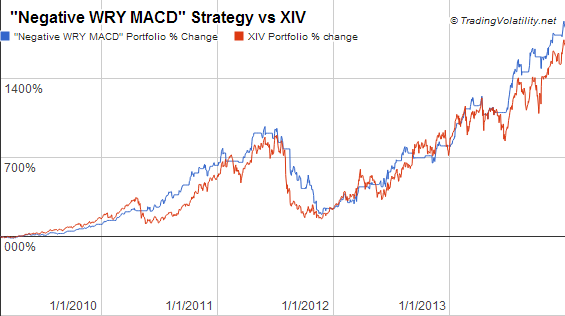
We previously outlined the performance of the WRY-10SMA strategy in this post. The new backtested performance is as follows:
A) Negative WRY MACD, 2013 (Link to Data)
Cumulative Return Jan 1, 2013 - Dec 31, 2013
- XIV: +107%
- "Negative WRY MACD": +141%
- # of Gains: 9
- # of Losses: 5
- Avg Return: +6.9%
- Max Gain: +36.0%
- Max Loss: -6.5%
B) Positive WRY MACD, 2013
"Positive WRY MACD" Trade Summary, 2013
- # of Gains: 5
- # of Losses: 9
- Avg Return: -0.8%
- Max Gain: +11.0%
- Max Loss: -11.5%
Old: WRY 10SMA, 2013 Performance
New: WRY MACD, 2013 Performance
Old: WRY 10SMA, 2009-2013 Performance
New: WRY MACD, 2009-2013 Performance
------------
Hypothetical and Simulated Performance Disclaimer
The results are based on simulated or hypothetical performance results that have certain inherent limitations. Unlike the results shown in an actual performance record, these results do not represent actual trading. Also, because these trades have not actually been executed, these results may have under- or over-compensated for the impact, if any, of certain market factors, such as lack of liquidity. Simulated or hypothetical trading programs in general are also subject to the fact that they are designed with the benefit of hindsight. No representation is being made that any account will or is likely to achieve profits or losses similar to these being shown. Additional performance differences in backtests arise from the methodology of using the 4:00pm ET closing values for XIV, VXX, and ZIV as an approximated trade prices for indicators that require VIX and VIX futures to settle at 4:15pm ET.


