Navigating the stock market in 2017 was easy. Shorting volatility was easy money. Picking individual stocks was easy and everyone was a brilliant strategist.
Then came 2018. The graph below highlights the fact that while less than 2% of assets were negative in 2017, 90% of assets are negative YTD in 2018 -- they highest percentage since... ever.
In another stark contrast to 2017, the short volatility ETPs have lost over 90% of their value in 2018 thanks to February's historic volatility spike. Last year's buy-and-hold everything strategy has been a bust across the board in 2018.
One of the few assets that lost in 2017 was volatility. Unsurprisingly, volatility has been one of the few bright spots in 2018 with the VIX index gaining +74% YTD and VXX +32% YTD.
What sort of market trends appear to be happening now and on tap for 2019?
- decelerating corporate earnings [now]
- late stages of the corporate debt cycle [now]
- decline of demand for U.S. Treasuries [now]
- quantitative tightening [now]
- slowing global growth [now]
- trend of de-dollarization [now]
- eventual reverse to more quantitative easing [late 2019]
That's a recipe for another difficult year for a range of assets with a strong possibility of wide movements within the equity markets as the year progresses. As we stated three years ago, traders need data-driven, reliable, observable, and easy-to-follow trading rules in order to set themselves up for consistent success. One of the reasons that 90% of people fail to make money at trading is they fail to have a process-oriented trading plan. As the saying goes, "Plan the trade. Trade the plan."
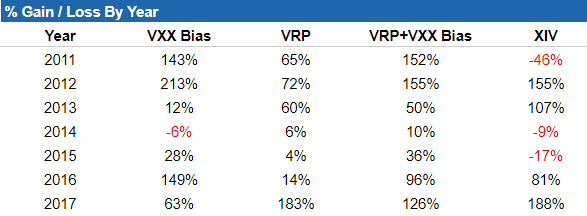
We think that volatility will again be a major factor within the markets in 2019. Our playbook to make money on short-term investing opportunities is to maintain a quantitative-driven investment process for volatility ETPs that has made us successful for the past 7+ years. Specifically, our VXX Bias and VRP indicators.
Why? Because they perform exceedingly well over the long term by trading both long volatility using VXX (soon to be replaced by VXXB) and short volatility using SVXY (previously using XIV).
We've previously noted that 2018 has given us trouble and that hasn't changed much since July. Our automated trading performance as tracked by a third party now stands at -22% for VRP+VXX Bias and +33% for VXX Bias. While the year is not yet over, those numbers are lagging average performance in most years. However, when the average annual return is north of 50% per year under a range of varying market conditions with best performance occurring during market drawdowns, it makes sense to stick with a good thing.
We take the guesswork out of the investing equation with a solid set of objective tools to guide decision making. At Trading Volatility our algorithms conduct daily monitoring of a variety of volatility-related data to generate our VXX Bias and VRP indicators which provide us with objective information about the likely direction of volatility ETPs, including VXX, VXXB, UVXY, TVIX, SVXY and ZIV.
Our algorithms continuously measure market data throughout each trading day and publish results on our subscribers' Intraday Indicator page. Our automation also emails and publishes the indicators' final values at the end of each day so that subscribers' can track the indicator of their choosing and act accordingly.
If you find yourself struggling in this market check us out. Stop guessing what will happen and sign up for our daily data-driven indicators for volatility ETPs. To learn more visit our Strategy page and Subscribe page or drop us a line via the Contact page.
------------
Hypothetical and Simulated Performance Disclaimer
The results are based on simulated or hypothetical performance results that have certain inherent limitations. Unlike the results shown in an actual performance record, these results do not represent actual trading. Also, because these trades have not actually been executed, these results may have under- or over-compensated for the impact, if any, of certain market factors, such as lack of liquidity. Simulated or hypothetical trading programs in general are also subject to the fact that they are designed with the benefit of hindsight. No representation is being made that any account will or is likely to achieve profits or losses similar to these being shown. Backtest results do not account for any costs associated with trade commissions or subscription costs. Additional performance differences in backtests arise from the methodology of using the 4:00pm ET closing values for SVXY, VXX, VXXB, and ZIV as approximated trade prices for indicators that require VIX and VIX futures to settle at 4:15pm ET.
Market Trends Point To Another Year of Volatility in 2019
By
Jay Wolberg
Posted on:
11/26/2018 12:47:00 PM
Subscribe to:
Comments (Atom)


