

As planned in the original VXX prospectus from its launch in 2009, VXX will be delisted as a security next week on Jan 30, 2019. Barclays has issued the replacement, VXXB, which is currently trading and is essentially identical to VXX.
To help with the transition, Barclays has published a VXX/VXXB comparison sheet as well as guidance around the transition process.
We have been keeping an eye on the outstanding number of ETNs for both VXX and VXXB over the past month. Very little progress has been made in the transition and VXX continues to hold about 3x the assets of VXXB, with VXX holding $921M as of yesterday.
If VXX's market cap does not come down substantially by Jan 28 there exists a potential for a temporary volatility crash on Jan 29 through Jan 30 as Barclays will need to pay cash out to holders on VXX on Jan 30.
However, as outlined in the guidance document, there exists an option for larger investors to take no action and simultaneously sell positions in VXX and buying equivalents in VXXB and may happen in the last days of VXX trading. This would be the smoothest transition route but it is not clear the percentage of holders will be utilizing this option.
Barclays To Replace VXX With VXXB
-JW
. . . . . . . . . . . . . .
 Stay up to date by having posts sent directly to your
RSS feed or
Email.

Market Trends Point To Another Year of Volatility in 2019
Navigating the stock market in 2017 was easy. Shorting volatility was easy money. Picking individual stocks was easy and everyone was a brilliant strategist.
Then came 2018. The graph below highlights the fact that while less than 2% of assets were negative in 2017, 90% of assets are negative YTD in 2018 -- they highest percentage since... ever.

In another stark contrast to 2017, the short volatility ETPs have lost over 90% of their value in 2018 thanks to February's historic volatility spike. Last year's buy-and-hold everything strategy has been a bust across the board in 2018.
One of the few assets that lost in 2017 was volatility. Unsurprisingly, volatility has been one of the few bright spots in 2018 with the VIX index gaining +74% YTD and VXX +32% YTD.
What sort of market trends appear to be happening now and on tap for 2019?
- decelerating corporate earnings [now]
- late stages of the corporate debt cycle [now]
- decline of demand for U.S. Treasuries [now]
- quantitative tightening [now]
- slowing global growth [now]
- trend of de-dollarization [now]
- eventual reverse to more quantitative easing [late 2019]
That's a recipe for another difficult year for a range of assets with a strong possibility of wide movements within the equity markets as the year progresses. As we stated three years ago, traders need data-driven, reliable, observable, and easy-to-follow trading rules in order to set themselves up for consistent success. One of the reasons that 90% of people fail to make money at trading is they fail to have a process-oriented trading plan. As the saying goes, "Plan the trade. Trade the plan."
We think that volatility will again be a major factor within the markets in 2019. Our playbook to make money on short-term investing opportunities is to maintain a quantitative-driven investment process for volatility ETPs that has made us successful for the past 7+ years. Specifically, our VXX Bias and VRP indicators.
Why? Because they perform exceedingly well over the long term by trading both long volatility using VXX (soon to be replaced by VXXB) and short volatility using SVXY (previously using XIV).
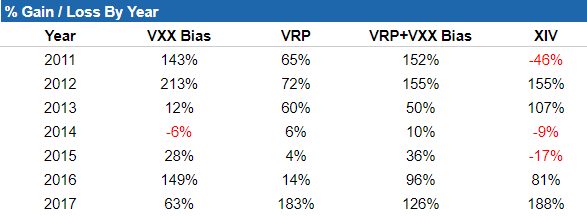
We've previously noted that 2018 has given us trouble and that hasn't changed much since July. Our automated trading performance as tracked by a third party now stands at -22% for VRP+VXX Bias and +33% for VXX Bias. While the year is not yet over, those numbers are lagging average performance in most years. However, when the average annual return is north of 50% per year under a range of varying market conditions with best performance occurring during market drawdowns, it makes sense to stick with a good thing.
We take the guesswork out of the investing equation with a solid set of objective tools to guide decision making. At Trading Volatility our algorithms conduct daily monitoring of a variety of volatility-related data to generate our VXX Bias and VRP indicators which provide us with objective information about the likely direction of volatility ETPs, including VXX, VXXB, UVXY, TVIX, SVXY and ZIV.
Our algorithms continuously measure market data throughout each trading day and publish results on our subscribers' Intraday Indicator page. Our automation also emails and publishes the indicators' final values at the end of each day so that subscribers' can track the indicator of their choosing and act accordingly.
If you find yourself struggling in this market check us out. Stop guessing what will happen and sign up for our daily data-driven indicators for volatility ETPs. To learn more visit our Strategy page and Subscribe page or drop us a line via the Contact page.
------------
Hypothetical and Simulated Performance Disclaimer
The results are based on simulated or hypothetical performance results that have certain inherent limitations. Unlike the results shown in an actual performance record, these results do not represent actual trading. Also, because these trades have not actually been executed, these results may have under- or over-compensated for the impact, if any, of certain market factors, such as lack of liquidity. Simulated or hypothetical trading programs in general are also subject to the fact that they are designed with the benefit of hindsight. No representation is being made that any account will or is likely to achieve profits or losses similar to these being shown. Backtest results do not account for any costs associated with trade commissions or subscription costs. Additional performance differences in backtests arise from the methodology of using the 4:00pm ET closing values for SVXY, VXX, VXXB, and ZIV as approximated trade prices for indicators that require VIX and VIX futures to settle at 4:15pm ET.
Then came 2018. The graph below highlights the fact that while less than 2% of assets were negative in 2017, 90% of assets are negative YTD in 2018 -- they highest percentage since... ever.

In another stark contrast to 2017, the short volatility ETPs have lost over 90% of their value in 2018 thanks to February's historic volatility spike. Last year's buy-and-hold everything strategy has been a bust across the board in 2018.
One of the few assets that lost in 2017 was volatility. Unsurprisingly, volatility has been one of the few bright spots in 2018 with the VIX index gaining +74% YTD and VXX +32% YTD.
What sort of market trends appear to be happening now and on tap for 2019?
- decelerating corporate earnings [now]
- late stages of the corporate debt cycle [now]
- decline of demand for U.S. Treasuries [now]
- quantitative tightening [now]
- slowing global growth [now]
- trend of de-dollarization [now]
- eventual reverse to more quantitative easing [late 2019]
That's a recipe for another difficult year for a range of assets with a strong possibility of wide movements within the equity markets as the year progresses. As we stated three years ago, traders need data-driven, reliable, observable, and easy-to-follow trading rules in order to set themselves up for consistent success. One of the reasons that 90% of people fail to make money at trading is they fail to have a process-oriented trading plan. As the saying goes, "Plan the trade. Trade the plan."
We think that volatility will again be a major factor within the markets in 2019. Our playbook to make money on short-term investing opportunities is to maintain a quantitative-driven investment process for volatility ETPs that has made us successful for the past 7+ years. Specifically, our VXX Bias and VRP indicators.
Why? Because they perform exceedingly well over the long term by trading both long volatility using VXX (soon to be replaced by VXXB) and short volatility using SVXY (previously using XIV).

We've previously noted that 2018 has given us trouble and that hasn't changed much since July. Our automated trading performance as tracked by a third party now stands at -22% for VRP+VXX Bias and +33% for VXX Bias. While the year is not yet over, those numbers are lagging average performance in most years. However, when the average annual return is north of 50% per year under a range of varying market conditions with best performance occurring during market drawdowns, it makes sense to stick with a good thing.
We take the guesswork out of the investing equation with a solid set of objective tools to guide decision making. At Trading Volatility our algorithms conduct daily monitoring of a variety of volatility-related data to generate our VXX Bias and VRP indicators which provide us with objective information about the likely direction of volatility ETPs, including VXX, VXXB, UVXY, TVIX, SVXY and ZIV.
Our algorithms continuously measure market data throughout each trading day and publish results on our subscribers' Intraday Indicator page. Our automation also emails and publishes the indicators' final values at the end of each day so that subscribers' can track the indicator of their choosing and act accordingly.
If you find yourself struggling in this market check us out. Stop guessing what will happen and sign up for our daily data-driven indicators for volatility ETPs. To learn more visit our Strategy page and Subscribe page or drop us a line via the Contact page.
------------
Hypothetical and Simulated Performance Disclaimer
The results are based on simulated or hypothetical performance results that have certain inherent limitations. Unlike the results shown in an actual performance record, these results do not represent actual trading. Also, because these trades have not actually been executed, these results may have under- or over-compensated for the impact, if any, of certain market factors, such as lack of liquidity. Simulated or hypothetical trading programs in general are also subject to the fact that they are designed with the benefit of hindsight. No representation is being made that any account will or is likely to achieve profits or losses similar to these being shown. Backtest results do not account for any costs associated with trade commissions or subscription costs. Additional performance differences in backtests arise from the methodology of using the 4:00pm ET closing values for SVXY, VXX, VXXB, and ZIV as approximated trade prices for indicators that require VIX and VIX futures to settle at 4:15pm ET.
-JW
. . . . . . . . . . . . . .
Stay up to date by having posts sent directly to your
RSS feed or
Email.
A Visualization of VIX Implied S&P 500 Movement
U.S. Equities have taken a hit in the first four weeks of October with the S&P 500 declining as much as -9%. The VIX has risen ~108% this month up to 25.23 as of the close yesterday.
As we have noted previously, a VIX of 25 seems a bit low given the magnitude of the daily movements. Below you can see daily S&P 500 returns and their corresponding VIX values on the big sell-off days 10/10/18 (-3.3%) and 10/24/18 (-3.1%).

Based on this historical data, we could reasonably expect VIX to be trading in the 30-45 range. However, the market is apparently not expecting large rallies over the next month.
Recall that the VIX is an expression of expected annualized market volatility over the next 30 days. A VIX of 25 means annualized move (up or down) of 25%. That value can be converted to monthly terms by dividing by the square root of 12, which yields an expected dispersion of the S&P 500 of 7.2%, or an implied range of 2463-2848.
We can convert that to a weekly and daily basis as well (divide by the square root of 52) to get a weekly dispersion of 3.5%, giving an implied range of 2558 to 2748 from yesterday's close. Interestingly, the 1-week dispersion target for $SPX based on $VIX after Oct 11th was 2820 (it came as high as 2817).
So perhaps $VIX isn't "too low" based on the magnitude of moves. Instead, it's more that investors don't expect a swift rally. Charting out the implied dispersion we can visualize the market's short-term expectations:

We can expect VIX to adjust accordingly as S&P 500 rises and falls. I'll provide updates within the Twitter thread on the subject.
As we have noted previously, a VIX of 25 seems a bit low given the magnitude of the daily movements. Below you can see daily S&P 500 returns and their corresponding VIX values on the big sell-off days 10/10/18 (-3.3%) and 10/24/18 (-3.1%).

Based on this historical data, we could reasonably expect VIX to be trading in the 30-45 range. However, the market is apparently not expecting large rallies over the next month.
Recall that the VIX is an expression of expected annualized market volatility over the next 30 days. A VIX of 25 means annualized move (up or down) of 25%. That value can be converted to monthly terms by dividing by the square root of 12, which yields an expected dispersion of the S&P 500 of 7.2%, or an implied range of 2463-2848.
We can convert that to a weekly and daily basis as well (divide by the square root of 52) to get a weekly dispersion of 3.5%, giving an implied range of 2558 to 2748 from yesterday's close. Interestingly, the 1-week dispersion target for $SPX based on $VIX after Oct 11th was 2820 (it came as high as 2817).
So perhaps $VIX isn't "too low" based on the magnitude of moves. Instead, it's more that investors don't expect a swift rally. Charting out the implied dispersion we can visualize the market's short-term expectations:

We can expect VIX to adjust accordingly as S&P 500 rises and falls. I'll provide updates within the Twitter thread on the subject.
-JW
. . . . . . . . . . . . . .
Stay up to date by having posts sent directly to your
RSS feed or
Email.
Our Indicators Performance Update - YTD Through July 2018
After a strong 2016 (+96%) and 2017 (+126%), our performance in 2018 has been rather lackluster so far.


As always, each day's indicator values, buy/sell triggers, trade performance summary, and equity curves are tracked in the spreadsheets linked at the bottom of our Subscribe page. Additional information on our trading strategy and indicators can be found on our Strategy page.
1Note: As mentioned in our previous post, you will find differences between the ideal/hypothetical indicator performance and actual trading performance for the following reasons:
- The VRP+VXX Bias indicator ("Trading Volatility 1" on C2) was launched on C2 on Feb 2, 2016.
- The VXX Bias indicator was launched on C2 on Feb 19, 2016
- Both C2 systems traded only 72%-80% of portfolio equity until April 1. After April 1, both C2 systems trade at ~97.5% portfolio equity (the ideal/hypothetical model portfolios trade at 100% equity).
- The ideal/hypothetical performance does not account for trade commissions or subscriptions costs.
The results are based on simulated or hypothetical performance results that have certain inherent limitations. Unlike the results shown in an actual performance record, these results do not represent actual trading. Also, because these trades have not actually been executed, these results may have under- or over-compensated for the impact, if any, of certain market factors, such as lack of liquidity. Simulated or hypothetical trading programs in general are also subject to the fact that they are designed with the benefit of hindsight. No representation is being made that any account will or is likely to achieve profits or losses similar to these being shown. Hypothetical and backtest results do not account for any costs associated with trade commissions or subscription costs. Additional performance differences in backtests arise from the methodology of using the 4:00pm ET closing values for SVXY, VXX, and ZIV as approximated trade prices for indicators that require VIX and VIX futures to settle at 4:15pm ET.
The biggest difference between this year and previous years is that the short volatility trade isn't working well. We've generally seen small roll yields, choppy market conditions with strong whipsaw reversals, and a VIX that closed the first day of the year with a record low close of 9.77 (47% below the median close on the first day of the year). As you can see in the graph below, the short volatility trade (via buying SVXY) has generally contributed between plus and minus 10% to performance of both indicators all year.

The long volatility trades (via buying VXX) helped the performance for the VXX Bias with YTD returns briefly exceeding 100% after February's historical VIX spike. Despite the initial success however, both VRP+VXX Bias and VXX Bias indicators gave back most of their long volatility gains after February, as shown in the graph below.

Putting both the long and short volatility trades together for 2018 we arrive at the following YTD performance (through July):
- VRP+VXX Bias: -19%
- VXX Bias: +37%
- VRP: -93%
- SVXY (buy and hold): -89%
This year's journey can be viewed in the equity curves below:

As we did during 2016 and 2017, we continue to send our automated trade alerts to Collective2's auto-trading platform. Below is how our indicators performed, as tracked by Collective2 (performance values and graphs here date back to launch in February 2016).1

Overall, I've been very happy with how the indicators have performed since they were launched on our website back in 2013, but this year has certainly been slow so far -- especially over the last four months.
As usual, I've updated the values for monthly returns and they have been updated on our Strategy page, as well as below.


Note: Trading Volatility+ subscribers have access to our VRP and VXX Bias indicators, our intraday indicator data, receive emails with preliminary and final change alerts for each of the indicators as well as our daily summaries, and interact with our private community of volatility traders in the forum. If interested, you can learn more about our services on our Subscribe page.
As always, each day's indicator values, buy/sell triggers, trade performance summary, and equity curves are tracked in the spreadsheets linked at the bottom of our Subscribe page. Additional information on our trading strategy and indicators can be found on our Strategy page.
1Note: As mentioned in our previous post, you will find differences between the ideal/hypothetical indicator performance and actual trading performance for the following reasons:
- The VRP+VXX Bias indicator ("Trading Volatility 1" on C2) was launched on C2 on Feb 2, 2016.
- The VXX Bias indicator was launched on C2 on Feb 19, 2016
- Both C2 systems traded only 72%-80% of portfolio equity until April 1. After April 1, both C2 systems trade at ~97.5% portfolio equity (the ideal/hypothetical model portfolios trade at 100% equity).
- The ideal/hypothetical performance does not account for trade commissions or subscriptions costs.
------------
Hypothetical and Simulated Performance DisclaimerThe results are based on simulated or hypothetical performance results that have certain inherent limitations. Unlike the results shown in an actual performance record, these results do not represent actual trading. Also, because these trades have not actually been executed, these results may have under- or over-compensated for the impact, if any, of certain market factors, such as lack of liquidity. Simulated or hypothetical trading programs in general are also subject to the fact that they are designed with the benefit of hindsight. No representation is being made that any account will or is likely to achieve profits or losses similar to these being shown. Hypothetical and backtest results do not account for any costs associated with trade commissions or subscription costs. Additional performance differences in backtests arise from the methodology of using the 4:00pm ET closing values for SVXY, VXX, and ZIV as approximated trade prices for indicators that require VIX and VIX futures to settle at 4:15pm ET.
-JW
. . . . . . . . . . . . . .
Stay up to date by having posts sent directly to your
RSS feed or
Email.
February YTD Performance of Our Volatility Indicator
2018 has gotten off to a wild start in the volatility world as volatility exploded higher in early February. The VIX Index recorded a new all-time 1-day gain of 115.6%, followed by a new all-time 1-day loss of -58% on the following day. This resulted in quite a bit of carnage, completely destroying XIV and causing large losses in SVXY.
Below are the equity curves of all strategies YTD 2018, compared to XIV (SVXY).

Our VRP+VXX Bias indicator has taken a hit, with a -6% return after the first two months of the year. The picture looks a little bit worse on Collective2 due to some platform execution errors.
VXX Bias outperformed with a buy of VXX in mid-January, reaching unrealized gains of over 100% YTD before giving quite a bit back to end February at +46%.
SVXY obviously took a hit and is -90% YTD. The standalone VRP strategy got caught holding SVXY/XIV and is tracking at -90% as well.
Cumulatively, VRP+VXX Bias has recorded a +201% gain since we started tracking performance by a third party in February 2016. Meanwhile VXX Bias had a large leap and is now +345% since launch on Collective2.

The "Trading Volatility 1" system is the auto-traded version of our VRP+VXX Bias indicator which we have published daily to Trading Volatility+ subscribers for nearly five years now.
Trading Volatility+ subscribers have access to our VRP and VXX Bias indicators, our intraday indicator data, receive emails with preliminary and final change alerts for each of the indicators as well as our daily summaries, and interact with our private community of volatility traders in the forum. If interested, you can learn more about our services on our Subscribe page.
As always, each day's indicator values, buy/sell triggers, trade performance summary, and equity curves are tracked in the spreadsheets linked at the bottom of our Subscribe page.
Additional information on our trading strategy and indicators, including the updated monthly performance tables, can be found on our Strategy page.
===
Hypothetical and Simulated Performance Disclaimer
The results are based on simulated or hypothetical performance results that have certain inherent limitations. Unlike the results shown in an actual performance record, these results do not represent actual trading. Also, because these trades have not actually been executed, these results may have under- or over-compensated for the impact, if any, of certain market factors, such as lack of liquidity. Simulated or hypothetical trading programs in general are also subject to the fact that they are designed with the benefit of hindsight. No representation is being made that any account will or is likely to achieve profits or losses similar to these being shown. Hypothetical backtest results do not account for any costs associated with trade commissions or subscription costs. Additional performance differences in backtests arise from the methodology of using the 4:00pm ET closing values for XIV, VXX, and ZIV as approximated trade prices for indicators that require VIX and VIX futures to settle at 4:15pm ET
Below are the equity curves of all strategies YTD 2018, compared to XIV (SVXY).

Our VRP+VXX Bias indicator has taken a hit, with a -6% return after the first two months of the year. The picture looks a little bit worse on Collective2 due to some platform execution errors.
VXX Bias outperformed with a buy of VXX in mid-January, reaching unrealized gains of over 100% YTD before giving quite a bit back to end February at +46%.
SVXY obviously took a hit and is -90% YTD. The standalone VRP strategy got caught holding SVXY/XIV and is tracking at -90% as well.
Cumulatively, VRP+VXX Bias has recorded a +201% gain since we started tracking performance by a third party in February 2016. Meanwhile VXX Bias had a large leap and is now +345% since launch on Collective2.

Trading Volatility+ subscribers have access to our VRP and VXX Bias indicators, our intraday indicator data, receive emails with preliminary and final change alerts for each of the indicators as well as our daily summaries, and interact with our private community of volatility traders in the forum. If interested, you can learn more about our services on our Subscribe page.
As always, each day's indicator values, buy/sell triggers, trade performance summary, and equity curves are tracked in the spreadsheets linked at the bottom of our Subscribe page.
Additional information on our trading strategy and indicators, including the updated monthly performance tables, can be found on our Strategy page.
===
Hypothetical and Simulated Performance Disclaimer
The results are based on simulated or hypothetical performance results that have certain inherent limitations. Unlike the results shown in an actual performance record, these results do not represent actual trading. Also, because these trades have not actually been executed, these results may have under- or over-compensated for the impact, if any, of certain market factors, such as lack of liquidity. Simulated or hypothetical trading programs in general are also subject to the fact that they are designed with the benefit of hindsight. No representation is being made that any account will or is likely to achieve profits or losses similar to these being shown. Hypothetical backtest results do not account for any costs associated with trade commissions or subscription costs. Additional performance differences in backtests arise from the methodology of using the 4:00pm ET closing values for XIV, VXX, and ZIV as approximated trade prices for indicators that require VIX and VIX futures to settle at 4:15pm ET
-JW
. . . . . . . . . . . . . .
Stay up to date by having posts sent directly to your
RSS feed or
Email.
Subscribe to:
Posts (Atom)