Historical Context Of The VIX And VIX Futures Super-Cycle

VIX perked up in July as it rose 65% from a low of 10.32 up to over 17 in early August. This translated to gains of almost 30% in VXX, which tracks the daily movement of first and second month VIX futures.

Looking at our chart showing the past six months of VIX and VIX futures movement (from the VIX Futures Data page) there is a pronounced rise in all VIX futures over the month of July, bringing levels back up to those last seen in March.


Market participants have become accustomed to these VIX spikes and stick to a playbook of shorting volatility as it approaches 20. Recently this strategy has worked well but will it always work?

To help answer that question I've created an Archives page dedicated to historical data of VIX futures, containing a visual representation of VIX futures data over the past eight years to document the most recent VIX super-cycle.

On this page you can see how VIX futures traded from the calm market of 2006 through the chaos of 2008, all the way back to the calm of 2014. To give this data some context I've also added a selection of the more significant news events that have impacted the market. This allows you to see when various events happened and how they impacted the market. Some examples covered are:
  • inversion of the bond yield curve in 2006,
  • Bear Stearns downgrade & liquidity rumors,
  • signing of the $700B financial bailout bill (Emergency Economic Stabilization Act of 2008),
  • points when QE1, QE2, and QE3 begin and end,
  • events leading up to the Flash Crash,
  • Greek voters reject ruling parties in elections to put bailout at risk and possibly leave the Euro.

Some of the more enlightening graphs are:

Feb 2007 - Aug 2007 when mortgage defaults were rising as adjustable rate mortgage payments reset. The effect was a 50% rise in front month VIX futures over four months while in a contango term structure.


... Feb 2010 - Aug 2010 as Greece requested a bailout and fear of contagion spread across Europe.


... and Aug 2012 - Feb 2013 which shows the magic moment when the FOMC unveiled its open-ended QE3 program to place the most recent lid over volatility. 


You can view all of the graphs on the Archives page. If you are a Trading Volatility+ subscriber you get the extra benefit of using interactive graphs for your research. If you are interested in becoming a subscriber you can do so at the Subscribe page.


. . . . . . . . . . . . . .

Stay up to date by having posts sent directly to your RSS feed or Email.

Trading Around VIX Seasonality

We're now well into the second half of the year and XIV is sitting on a nice little gain of 28% YTD. But considering that the average annual return for XIV over the past two years is 114%, it is actually struggling a bit. So far this year the VXX weekly roll yield has averaged just -1.14% which will keep gains in check as illustrated by our XIV roll yield scatter plot (from my April post about reducing short volatility profit expectations). The current VXX Bias is only slightly negative, indicating a weak downward trend in VXX (weak upward trend for XIV) that is vulnerable to occasional spikes.
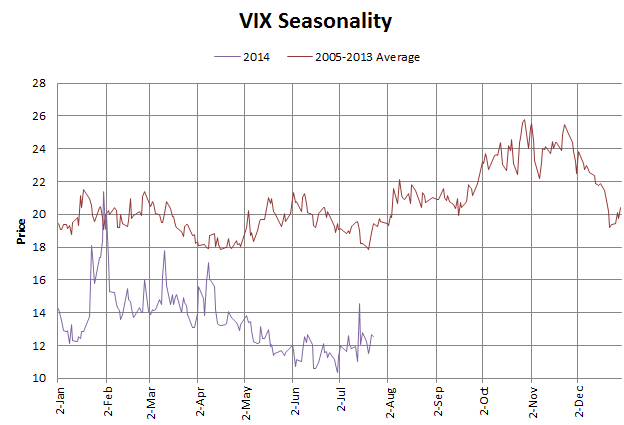
Over the past few weeks it increasingly appears as if the bulls may be losing momentum. Perhaps adding to the jitters is a chart of VIX seasonality that is currently making the rounds. I've included a chart below showing the average VIX from 2005-2013 compared to VIX in 2014.

From the chart we can see that July, August, September and October see increases in VIX (on average). While this is somewhat insightful, the chart is distorted fairly heavily by elevated VIX levels during the second halves of 2007, 2008, and 2011. The distortion is so great that even if we look at seasonality of the VIX for every year back to 1990 we still see the same seasonality trends. Yet in many of those years we saw volatility remain flat or decrease in the second half of the year. It is critical to remember that each year is unique and we must trade the data in the environment that we are in rather than trading the average of historical data. We will need to wait for each day to unfold in order to gather objective data about the state of the current market and trade accordingly.
At this time there is no reason to get too aggressive shorting VXX given the small weekly roll yield. Often the best trade when there is a weak or neutral Bias is to wait for a stronger trend to be established and I think that makes a lot of sense here. Taking smaller positions in XIV as long as the VXX Bias is negative would not be a terrible trade but positions really need to be watched in case we start seeing bearish momentum pick up. The line in the sand for XIV appears to be $44.50 (it closed Monday at $44.08). If it can get above that level and hold XIV could see some more gains here soon. 


. . . . . . . . . . . . . .

Stay up to date by having posts sent directly to your RSS feed or Email.

Objective Signals For Trading VXX, UVXY, and XIV

The market made an impressive run in May with the S&P 500 hitting new all-time highs at 1955.55 and the VIX touching 10.73. With each passing day during this run it seemed there was yet another article claiming that the market is too high or the VIX too low. With actual volatility of the S&P 500 over the past month just 6.42, a VIX in the 10-12 range makes some sense. But rather than speculate on where the VIX should be, the more profitable question is how to trade the volatility ETPs at these levels.

It's dangerous for investors to speculate on where the market will go next without a solid set of objective tools to guide decision making. At Trading Volatility we rely on our proprietary Bias and Spike Risk indicators to provide us with objective information about the likely direction and momentum of volatility ETPs such as VXX, UVXY, TVIX, XIV, SVXY and ZIV.  The daily signals from our indicators make it possible to substantially outperform the market and today I'll provide a closer look at these signals.

VXX Bias Forecast
After the close on each market day our algorithms generate the Bias and Spike Risk forecasts for the following day and publish the data on our Daily Forecast page. We track all of our forecasts and compare the values to the actual movement of VXX, as shown in the graph of our forecasts over the past six months, below.


Here I've highlighted two distinct periods. The first is from Jan 24th to April 28, a three-month period in which the VXX Bias forecast (the blue line, using the left axis) stayed slightly negative with a handful of moves to a positive Bias. This block of forecasts provides us with an indication that there is no real advantage in shorting VXX (or buying the inverse, XIV) given that there is no directional Bias to help us in our trade. While VXX (red line, using the right axis) did see some price spikes during this time, they were short-lived as the Bias failed to remain positive.

Looking at the second period from April 29 to June 11, the VXX Bias was more solidly negative with Bias reading between -1 and -2. These readings told us that the wind was at our back to short VXX (or buy XIV) as VXX fell over 25% during this time. As of the evening of June 11, the VXX Bias jumped back up toward zero remaining just slightly negative, to once again let us know that it is time to be a bit cautious shorting volatility.


VXX Spike Risk Forecast
The VXX Spike Risk forecast provides us with information on the probability of a VXX spike (for our purposes, a "spike" is defined as a move of 7% or more over the next two trading days). As with the VXX Bias, we track our daily Spike Risk forecasts against the percent change of VXX for each day. The graph below captures forecasts vs actuals for the last six months.


We've only seen one period of sustained VXX Spike Risk (blue line, using the left axis) above 50%, which took place in late January/early February when we saw the big upward +30% move in VXX.  Other than that we've only seen a handful of forecasts reaching above 40%. Looking at the recent period from 4/22 to 6/10 you can see a string of low Spike Risk forecasts below 28% and as low as 16%, indicating time to be a bit more aggressive in shorting VXX. This worked out very well as the price of VXX fell on almost every day during this period (red line, using the right axis). For June 12 we saw a Spike Risk of 49% on a day when VXX gained 6.5% intraday, and today's forecast (June 16) was back up to 48%, once again indicating that we need to be more cautious.


The market provides subtle clues for what the it might do next. As you have now seen, we incorporate these clues into our algorithms to generate what we believe are the best indicators available. If you find yourself struggling in this market check us out. To learn more visit our Subscribe page or drop us a line via the Contact page.


. . . . . . . . . . . . . .

Stay up to date by having posts sent directly to your RSS feed or Email.

The Quest To Outperform The Market

Chances are, if you're an active trader in this market you are struggling to make money. In reality it's a tough game, one in which hedge funds and mutual funds constantly underperform the market.  In 2012, 88% of hedge funds and 65% of mutual funds underperformed the S&P 500 benchmark. In 2013, the hedge fund average trailed the S&P 500 for the fifth straight year with a 7.4% return, 23 percentage points below the S&P 500.

Why do so many professionals and individual investors lose money? Because in order to be successful in trading you need both a good plan and the discipline to execute against the plan. Without both of these a trader will fail to make money consistently.

While we can't really help you with the discipline, we can help you with the plan. We focus most on trading two securities, VXX (the "volatility futures fund") and XIV (the "inverse volatility futures fund"), based on the direction of the fund's built-in Bias. The Bias is our proprietary way of measuring the current directional force on the fund and is primarily based on the price structure of VIX futures and the internal mechanisms that the funds use to manage their holdings. As these values change each day we measure and report on the Biases in our Daily Forecasts so that we know both their direction and magnitude.

With that information, we apply the simple strategy of buying XIV when the VXX Bias is negative, or buying VXX when the VXX Bias is positive. Trading in the direction of the Bias is critical since it can impact the price of the fund by as much as 10% per week. Trading in the direction of the Bias allows traders to take advantage of the funds structure and can provide an edge in trading.

Over the past couple years, XIV has become a popular fund to own with annual returns of 142% and 85% in 2012 and 2013, respectively. But this is not a fund to buy and hold since it is prone to 80%+ losses if the Bias reverses (see XIV: When a "Sure Thing" Goes Bad). You can see in the table below that while the average annual return of XIV is 46%*, it experienced several ugly years when there was an unfavorable Bias. Rather than suffer through these losses, XIV can be sold whenever the VXX Bias is positive to help reduce drawdowns. This "Negative VXX Bias" strategy has been shown to substantially outperform XIV in 6 of the past 8 years, with an average excess performance of 48 percentage points (far right column, below).


% Gain / Loss By Year
YearXIV"Negative VXX Bias" Strategy"Positive VXX Bias" StrategyExcess performance over XIV using "Negative VXX Bias"
200673%60%-15%-13%
2007-51%-34%13%17%
2008-71%-8%128%63%
2009103%116%-9%13%
2010135%284%42%149%
2011-47%45%61%92%
2012142%216%11%74%
201385%74%-30%-11%
Average46%94%25%48%


A look at each year's performance of the "Negative VXX Bias" strategy shows that while it is still vulnerable to losses, overall the strategy has done exceedingly well compared to the alternatives. A comparison of the annual returns of XIV vs the "Negative VXX Bias" strategy is better visualized below.


You can get a feel for how the strategy performs on a day-to-day basis by looking at the each of the performance data files (**links located at the bottom of this post). In these files you can view a graph of the daily value of a portfolio employing each strategy. The chart below compares the "Negative VXX Bias" strategy to XIV during 2011. Note the flat blue line which illustrates that XIV was not owned in the "Negative VXX Bias" strategy during the time XIV experienced steep losses because there was a positive VXX Bias.


The performance data files also contain the forecast VXX Bias values, entry and exit points, and gain/loss data including a histogram of trades. Below is a summary of trades each year for the "Negative VXX Bias" strategy.

Number Of Trades Per Year For Negative VXX Bias Strategy
Year# of TradesWinnersLosersAvg Trade Gain/Loss
200612664.94%
20071459-2.43%
20081376-0.33%
200911658.05%
201075323.34%
201110374.54%
2012115612.51%
201315874.27%


Given the size of gains & losses I've discussed so far it should be clear that these strategies typically align with traders who have a relatively high tolerance for risk. They are not for everyone and they are certainly not for anyone who does not pay attention to the changing Bias of the funds. However, if you're a trader who has decided that these types of funds are right for you, we would love to provide you with the tools to assist in your analysis and decision making process.

In addition to tracking these Biases on our website, we can also send email alerts to let subscribers know when the VXX Bias has changed direction. To learn more about the services we provide you can check out our Subscribe page, or drop us a line via the Contact page. You can also chat with us on Twitter at @tradevolatility if you like. We're here to help and answer any questions you might have about the world of volatility!


------------

*Daily prices for VXX and XIV prior to fund inception have been derived from existing VIX futures data. Backtests use each security's 4:00pm ET closing value as an approximated trade price for indicators that require VIX and VIX futures to settle at 4:15pm ET.

**Data files: 2006, 2007, 2008, 2009, 2010, 2011, 2012, 2013, 2014


------------
Hypothetical and Simulated Performance Disclaimer
The results are based on simulated or hypothetical performance results that have certain inherent limitations. Unlike the results shown in an actual performance record, these results do not represent actual trading. Also, because these trades have not actually been executed, these results may have under- or over-compensated for the impact, if any, of certain market factors, such as lack of liquidity. Simulated or hypothetical trading programs in general are also subject to the fact that they are designed with the benefit of hindsight. No representation is being made that any account will or is likely to achieve profits or losses similar to these being shown. Additional performance differences in backtests arise from the methodology of using the 4:00pm ET closing values for XIV, VXX, and ZIV as an approximated trade prices for indicators that require VIX and VIX futures to settle at 4:15pm ET.


. . . . . . . . . . . . . .

Stay up to date by having posts sent directly to your RSS feed or Email.

VXX Bias Forecast Performance Review, 2014 Year-to-Date

With one third of 2014 now behind us, it's a good time to take a look at year-to-date performance of our Bias strategy. The U.S. stock market has been mixed so far this year (through May 9, 2014) with the S&P 500 index gaining 1.6%,  the Russell 2000 down 4.8%, and the NASDAQ 100 down 1%. The VIX has lost 5.8% YTD although it has seen some wild swings already, gaining 56.3% in early February before returning back to where it started.

At Trading Volatility we focus on trading of VIX ETPs with most attention on VXX and XIV. Today we'll review the year-to-date performance of the VXX Bias forecasts, which are generated after each trading day at 4:30pm ET.
- For those of you who are unfamiliar with our daily Bias forecasts more information can be found on the Daily Forecast page.
- For backtested performance of the Bias strategy dating back to 2006 please see this post.

VXX Bias Indicator Performance, 2014 YTD (Data sheet with trade and performance details)
As usual, we'll review the performance of the indicators in two halves:
1) the "Negative VXX Bias" strategy which involves buying XIV whenever the VXX Bias is negative, and
2) the "Positive VXX Bias" strategy which involves buying VXX whenever the VXX Bias is positive.

1) Negative VXX Bias Strategy
The VXX Bias forecasts are designed to help traders identify the direction and magnitude of any headwinds/tailwinds in VXX and XIV that arise from the structure and momentum of the underlying VIX futures securities. So far this year the Bias forecasts have identified a key change in market structure in early January to give traders a chance to exit positions in XIV before the full 29% drawdown (see graph below). Confident investors sparked a stock market rebound to keep that drawdown contained, but we've seen a mostly sideways/choppy market with a neutral VXX Bias for the majority of the year. Long-time readers of our posts will know that a neutral Bias makes for little or no trading edge in VIX ETPs, making for a more difficult trading environment. However, in late April & early May we've seen the VXX Bias grow more negative and exit the neutral zone to drive new lows in VXX and drive price higher in XIV.
- As of May 9, XIV has returned 0% YTD vs +3% with the Negative VXX Bias strategy.


2) Positive VXX Bias Strategy
We've seen several moves to a positive VXX Bias this year but only one instance has lasted more than a handful of days. In the January instance the VXX Bias remained positive for 13 days, with VXX gaining over 30% before finally closing out a 10.8% gain. Most of the remaining VXX trades have ended with small losses in typical VXX behavior. 2014 has once again demonstrated that while VXX can see good short-term gains, they tend to be fleeting when the Bias quickly returns to negative.


------------
Hypothetical and Simulated Performance Disclaimer
TThe results are based on simulated or hypothetical performance results that have certain inherent limitations. Unlike the results shown in an actual performance record, these results do not represent actual trading. Also, because these trades have not actually been executed, these results may have under- or over-compensated for the impact, if any, of certain market factors, such as lack of liquidity. Simulated or hypothetical trading programs in general are also subject to the fact that they are designed with the benefit of hindsight. No representation is being made that any account will or is likely to achieve profits or losses similar to these being shown. Additional performance differences in backtests arise from the methodology of using the 4:00pm ET closing values for XIV, VXX, and ZIV as an approximated trade prices for indicators that require VIX and VIX futures to settle at 4:15pm ET.


. . . . . . . . . . . . . .

Stay up to date by having posts sent directly to your RSS feed or Email.