

In preparation for trading VIX ETPs in 2016, I wanted to share the expiration date for all monthly VIX futures next year as well as the number of days in each roll period. Table below (source calendar).
Expiration Date Roll Period Length
- Ending January 20: 23 days
- Ending February 17: 19 days
- Ending March 16: 20 days
- Ending April 20: 24 days
- Ending May 18: 20 days
- Ending June 15: 19 days
- Ending July 20: 24 days
- Ending August 17: 20 days
- Ending September 21: 19 days
- Ending October 19: 20 days
- Ending November 16: 20 days
- Ending December 21: 24 days
2016 VIX Futures Expiration Days And Roll Period Lengths
-JW
. . . . . . . . . . . . . .
 Stay up to date by having posts sent directly to your
RSS feed or
Email.

The Most Important Chart For Trading Volatility ETPs
On April 5, 2014 I wrote an article titled Shorting Volatility: Time To Reduce Profit Expectations for 2014 which outlined why I thought it would be difficult for XIV (the fund which tracks the inverse daily return of volatility futures) to finish positive for 2014. When the article was published XIV had returned an impressive +547% over the past 28 months, as shown in the chart below.

Understandably, many people disagreed with my view, yet XIV finished the 2014 year -9%.
Later in 2014 (September) I wrote The End of an Era for the Market, in which I discussed how a choppy market that is no longer a reliable environment for shorting volatility had become the norm as the Fed concluded their QE program. XIV lost 37% of its value over the next four months and is currently down 30% since that post.
If it wasn't already clear, XIV is not a buy and hold security. It has returned -20% over the past year and -7% over the past two years. The environment is not the same as what it was in 2012 and 2013.
How did I make these calls?
Because returns in XIV are heavily dependent on the Weekly Roll Yield (WRY).
A major factor for the lower returns in the past two years comes from a smaller weekly roll yield that is used to propel XIV. The inverse of the XIV WRY is the VXX WRY (which comes from the difference between first and second month VIX futures). We track this important metric on our site, and as you can see in the graph below, the roll yield has moved from -2% to -1% over the past several years and has recently started to move toward 0%.
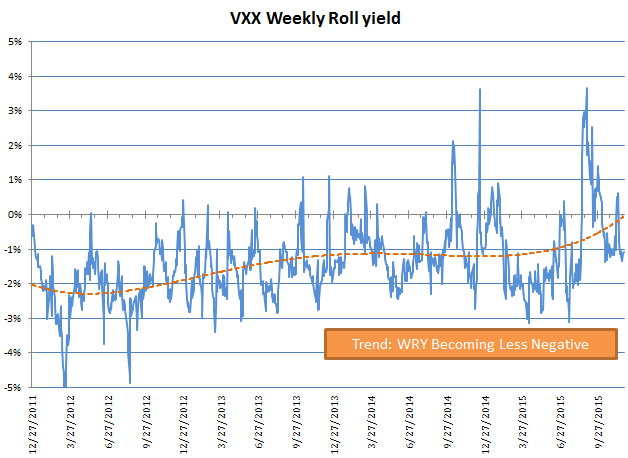
This is most important graph because the WRY serves as a headwind or tailwind to VIX ETPs. As the WRY approaches zero, trends become less stable and our advantage in trading XIV or VXX diminishes. Conversely, as the WRY moves away from zero trends become stronger.
Right now there is less of a headwind for VXX and less of a tailwind for XIV/SVXY. At this point in our old bull market we are also at high risk for the VXX WRY turning positive, which would give VXX a tailwind and XIV a headwind.
Revisiting our graph which compares the annual returns of XIV to the average Weekly Roll Yield (below), we can see why the WRY is so important.

Looking at the trendline we can see that with a fairly constant 1% WRY, we can generally expect XIV to return ~+25% per year. As the average WRY moves towards 2% we can expect XIV to return ~+120% per year. At 0%, XIV is likely to return ~-60%. The recent shrinking of the WRY from 2% to 1% has an enormous impact on returns and that's why it is so important. A continued move of the WRY toward 0% or higher would be alarming to investors who plan to buy-and-hold XIV.
Because the WRY is such an important factor in the performance of VIX ETPs, our approach is to trade XIV and VXX using the WRY as a primary input for our VXX Bias and ZIV Bias indicators (our strategies are outlined here). While XIV is negative on the year, our VXX Bias indicator has put forth a performance of +33% YTD.
No credible trader will ever say that trading is easy, and that is doubly true when it comes to volatility. It requires a deep understanding of market forces, a solid process-oriented plan, and discipline in execution. In the current environment it will be more important than ever to stay on top of changing conditions.
We have been in the business of helping traders stay on top of the volatility market for three years now. We look forward to a fourth year of providing a variety of free data services throughout our website and are always happy to answer questions submitted through our Contact page. We also offer subscriber services to people looking for additional data, metrics, automated alerts and daily summaries, and access to a community of volatility traders. If you're interested, don't hesitate to drop us a line.
------------
Hypothetical and Simulated Performance Disclaimer
The results are based on simulated or hypothetical performance results that have certain inherent limitations. Unlike the results shown in an actual performance record, these results do not represent actual trading. Also, because these trades have not actually been executed, these results may have under- or over-compensated for the impact, if any, of certain market factors, such as lack of liquidity. Simulated or hypothetical trading programs in general are also subject to the fact that they are designed with the benefit of hindsight. No representation is being made that any account will or is likely to achieve profits or losses similar to these being shown. Additional performance differences in backtests arise from the methodology of using the 4:00pm ET closing values for XIV, VXX, and ZIV as approximated trade prices for indicators that require VIX and VIX futures to settle at 4:15pm ET.

Understandably, many people disagreed with my view, yet XIV finished the 2014 year -9%.
Later in 2014 (September) I wrote The End of an Era for the Market, in which I discussed how a choppy market that is no longer a reliable environment for shorting volatility had become the norm as the Fed concluded their QE program. XIV lost 37% of its value over the next four months and is currently down 30% since that post.
If it wasn't already clear, XIV is not a buy and hold security. It has returned -20% over the past year and -7% over the past two years. The environment is not the same as what it was in 2012 and 2013.
How did I make these calls?
Because returns in XIV are heavily dependent on the Weekly Roll Yield (WRY).
A major factor for the lower returns in the past two years comes from a smaller weekly roll yield that is used to propel XIV. The inverse of the XIV WRY is the VXX WRY (which comes from the difference between first and second month VIX futures). We track this important metric on our site, and as you can see in the graph below, the roll yield has moved from -2% to -1% over the past several years and has recently started to move toward 0%.

This is most important graph because the WRY serves as a headwind or tailwind to VIX ETPs. As the WRY approaches zero, trends become less stable and our advantage in trading XIV or VXX diminishes. Conversely, as the WRY moves away from zero trends become stronger.
Right now there is less of a headwind for VXX and less of a tailwind for XIV/SVXY. At this point in our old bull market we are also at high risk for the VXX WRY turning positive, which would give VXX a tailwind and XIV a headwind.
Revisiting our graph which compares the annual returns of XIV to the average Weekly Roll Yield (below), we can see why the WRY is so important.

Looking at the trendline we can see that with a fairly constant 1% WRY, we can generally expect XIV to return ~+25% per year. As the average WRY moves towards 2% we can expect XIV to return ~+120% per year. At 0%, XIV is likely to return ~-60%. The recent shrinking of the WRY from 2% to 1% has an enormous impact on returns and that's why it is so important. A continued move of the WRY toward 0% or higher would be alarming to investors who plan to buy-and-hold XIV.
Because the WRY is such an important factor in the performance of VIX ETPs, our approach is to trade XIV and VXX using the WRY as a primary input for our VXX Bias and ZIV Bias indicators (our strategies are outlined here). While XIV is negative on the year, our VXX Bias indicator has put forth a performance of +33% YTD.
No credible trader will ever say that trading is easy, and that is doubly true when it comes to volatility. It requires a deep understanding of market forces, a solid process-oriented plan, and discipline in execution. In the current environment it will be more important than ever to stay on top of changing conditions.
We have been in the business of helping traders stay on top of the volatility market for three years now. We look forward to a fourth year of providing a variety of free data services throughout our website and are always happy to answer questions submitted through our Contact page. We also offer subscriber services to people looking for additional data, metrics, automated alerts and daily summaries, and access to a community of volatility traders. If you're interested, don't hesitate to drop us a line.
------------
Hypothetical and Simulated Performance Disclaimer
The results are based on simulated or hypothetical performance results that have certain inherent limitations. Unlike the results shown in an actual performance record, these results do not represent actual trading. Also, because these trades have not actually been executed, these results may have under- or over-compensated for the impact, if any, of certain market factors, such as lack of liquidity. Simulated or hypothetical trading programs in general are also subject to the fact that they are designed with the benefit of hindsight. No representation is being made that any account will or is likely to achieve profits or losses similar to these being shown. Additional performance differences in backtests arise from the methodology of using the 4:00pm ET closing values for XIV, VXX, and ZIV as approximated trade prices for indicators that require VIX and VIX futures to settle at 4:15pm ET.
-JW
. . . . . . . . . . . . . .
Stay up to date by having posts sent directly to your
RSS feed or
Email.
The Classic Long Term Investment Model
In a change of pace, today's post is a gift for the more passive retirement investor. I will share a common investing template used by Financial Advisors as well as the new Robo-advisors. If you are a "do-it-yourselfer" this info can save you tens of thousands of dollars in fees that would otherwise go to an advisor.
The basic portfolio strategy used by many FAs is based on Modern Portfolio Theory (MPT). The main idea is to diversify investments across various categories of global assets in order to reduce overall portfolio risk. This is accomplished by allocating dollars to a mix of equity and bond funds. People who have a longer investment horizon typically utilize a more aggressive investment approach which places a heavier weighting on equities. This weighting shifts gradually towards a larger weighting on bonds as you get close to your retirement date.
The following chart provides example fund allocations.

The strategy dictates that once you decide on your overall portfolio balance you allocate funds based on the percentages in that column. Every six months you need to re-balance your portfolio by buying and selling securities in amounts so that they again match the target allocation percentages. Any additional contributions made to the fund are done using the weightings specified.
Modern Portfolio Theory is the most widely accepted framework for managing diversified investment portfolios, however it has its limitations. One such limitation is the fact that it ignores the possibility of significant market selloffs. Overall returns can be improved by augmenting the basic MPT framework with a sound strategy for including volatility funds in the model, however I'll need to cover that in a future post.
The above chart can be very helpful, but if you are not willing or able to rebalance the portfolio then you will likely not be optimizing your returns. In addition, if you are someone who gets nervous and wants to sell anytime the market becomes dramatic then you may have difficulties sticking to an investment plan. One part of a FA's job is to keep you invested and on a plan to help prevent you from selling when it is not beneficial to do so (more on Financial Advisors below).
A Note On Financial Advisors
A good Financial Advisor will provide more that just the investment strategy offered above. They will also help open a dialogue about what financial needs you and your family have and help you develop and execute plans to achieve those goals. They can help you with things like saving for retirement, saving for a house, saving for education, budgeting, tax strategies, and develop custom investment solutions should you have specific needs.
A Note On Robo-Advisors
Robo-Advisors are good for people who want to just set their portfolio agressiveness and have the rest automated. You're still mostly on your own but the fees are much lower so it can be a good alternative to a traditional Financial Advisor for people with simple needs. Robo-Advisors like to highlight their tax optimization feature through something called Tax-Loss Harvesting. For anyone using a retirement account, Tax-Loss Harvesting is completely irrelevant because most retirement accounts are tax deferred.
Disclaimer
The above information is for educational purposes only and is not financial advice.
The basic portfolio strategy used by many FAs is based on Modern Portfolio Theory (MPT). The main idea is to diversify investments across various categories of global assets in order to reduce overall portfolio risk. This is accomplished by allocating dollars to a mix of equity and bond funds. People who have a longer investment horizon typically utilize a more aggressive investment approach which places a heavier weighting on equities. This weighting shifts gradually towards a larger weighting on bonds as you get close to your retirement date.
The following chart provides example fund allocations.

The strategy dictates that once you decide on your overall portfolio balance you allocate funds based on the percentages in that column. Every six months you need to re-balance your portfolio by buying and selling securities in amounts so that they again match the target allocation percentages. Any additional contributions made to the fund are done using the weightings specified.
Modern Portfolio Theory is the most widely accepted framework for managing diversified investment portfolios, however it has its limitations. One such limitation is the fact that it ignores the possibility of significant market selloffs. Overall returns can be improved by augmenting the basic MPT framework with a sound strategy for including volatility funds in the model, however I'll need to cover that in a future post.
The above chart can be very helpful, but if you are not willing or able to rebalance the portfolio then you will likely not be optimizing your returns. In addition, if you are someone who gets nervous and wants to sell anytime the market becomes dramatic then you may have difficulties sticking to an investment plan. One part of a FA's job is to keep you invested and on a plan to help prevent you from selling when it is not beneficial to do so (more on Financial Advisors below).
A Note On Financial Advisors
A good Financial Advisor will provide more that just the investment strategy offered above. They will also help open a dialogue about what financial needs you and your family have and help you develop and execute plans to achieve those goals. They can help you with things like saving for retirement, saving for a house, saving for education, budgeting, tax strategies, and develop custom investment solutions should you have specific needs.
A Note On Robo-Advisors
Robo-Advisors are good for people who want to just set their portfolio agressiveness and have the rest automated. You're still mostly on your own but the fees are much lower so it can be a good alternative to a traditional Financial Advisor for people with simple needs. Robo-Advisors like to highlight their tax optimization feature through something called Tax-Loss Harvesting. For anyone using a retirement account, Tax-Loss Harvesting is completely irrelevant because most retirement accounts are tax deferred.
Disclaimer
The above information is for educational purposes only and is not financial advice.
-JW
. . . . . . . . . . . . . .
Stay up to date by having posts sent directly to your
RSS feed or
Email.
A Focus On Process Is Critical To A Trader's Long-Term Success
We are now eight months into 2015 and it's time to once again check in on YTD performance. The last three months have been difficult for the market and we saw a great example of why successful traders are process-oriented rather than results-oriented. So before we get to the scoreboard, let's look at the difference between the two.


Traders need data-driven, reliable, observable, and easy-to-follow trading rules in order to set themselves up for success. Talk to any successful professional and you'll get hear the common theme of process-orientation as one of the keys to success. I'll talk more about how this came into play later in this post.
Now, on to the scoreboard.
The S&P 500 and XIV ("short" volatility ETP) have suffered since our May update, with the S&P 500 -4.2% on the year and XIV now -18% through August. VXX ("long" volatility ETP) is in the same ballpark at -15% while ZIV ("short" medium-term volatility ETP) is -8%.
Now, on to the scoreboard.
The S&P 500 and XIV ("short" volatility ETP) have suffered since our May update, with the S&P 500 -4.2% on the year and XIV now -18% through August. VXX ("long" volatility ETP) is in the same ballpark at -15% while ZIV ("short" medium-term volatility ETP) is -8%.
Fortunately we're not part of the buy-and-hold crowd and instead use our custom indicators to trade volatility ETPs on both the long and short sides (learn more about our strategies here).
Our indicators now sit at (year-to-date, through August):
- VRP+VXX Bias: +40%
- VXX Bias: +69%
- VRP: -7%
- ZIV Bias: -2%
Overall, our indicators actually lost ground since their peaks in June after facing some difficult market conditions from late-June to mid-August. The equity curve can be seen below.

While it can be frustrating to watch some of our gains disappear, this is where the process-orientation kicks in. We know that drawdowns happen in volatility trading, and when they do we refer to our flow chart from above.
Did we lose because we adhered to the trading rules?
Or did we lose because we broke the rules?
Even when you adhere to the rules, the "No big deal" attitude is tough to achieve when dealing with losers. This is especially true when they are back-to-back-to-back-to-back and result in multiple monthly losses. But while those short-term losses can feel painful, it's the long term that we care about. The pros continue to focus on the process of trading using proven indicators rather than short-term outcomes.
Did we lose because we adhered to the trading rules?
Or did we lose because we broke the rules?
Even when you adhere to the rules, the "No big deal" attitude is tough to achieve when dealing with losers. This is especially true when they are back-to-back-to-back-to-back and result in multiple monthly losses. But while those short-term losses can feel painful, it's the long term that we care about. The pros continue to focus on the process of trading using proven indicators rather than short-term outcomes.
By looking specifically at monthly returns we can get a feel for how bad the past few months have been. First, the VRP+VXX Bias indicator had two consecutive months in June and July that were almost as bad as any on record, before recovering a bit in August.

The next chart shows monthly performance for the VXX Bias indicator. Once again, June and July saw two of the worst consecutive months on record, with performance very similar to that of June/July 2011.

August, however, turned in the third best month ever, rewarding those able to keep trades mechanical and process-driven.
For those interested in additional details of the indicators, the daily history of indicator values that have been emailed to subscribers in 2015 can be found in the data sheet links below:
If you're struggling to meet your investment objectives in this year's difficult market, perhaps we can help. For less than $3 per day we provide subscribers access to all of our VIX data & metrics, our indicators, automated change alerts, and the members' forum.
______
Hypothetical and Simulated Performance Disclaimer
The results are based on simulated or hypothetical performance results that have certain inherent limitations. Unlike the results shown in an actual performance record, these results do not represent actual trading. Also, because these trades have not actually been executed, these results may have under- or over-compensated for the impact, if any, of certain market factors, such as lack of liquidity. Simulated or hypothetical trading programs in general are also subject to the fact that they are designed with the benefit of hindsight. No representation is being made that any account will or is likely to achieve profits or losses similar to these being shown. Additional performance differences in backtests arise from the methodology of using the 4:00pm ET closing values for XIV, VXX, and ZIV as approximated trade prices for indicators that require VIX and VIX futures to settle at 4:15pm ET.
-JW
. . . . . . . . . . . . . .
Stay up to date by having posts sent directly to your
RSS feed or
Email.
Our Indicator Performance: +71% YTD Through May
Inverse volatility ETFs continued their uptrend in May with XIV adding 13.4% during the month, bringing its year-to-date gains up to +45%. Here's a look at XIV's YTD chart:

A 45% gain in the first five months of the year is pretty good, but our indicators are all outperforming the buy-and-hold approach. Here is the performance of our indicators in 2015, through May 29th:
- VXX Bias: +69%
- VRP: +60%
- VRP+VXX Bias: +71%
The equity curve for each strategy with comparison to XIV is shown in the following graph (the S&P 500 is +2.4% YTD and is not shown):

Trade statistics for each strategy are summarized as follows:


A 45% gain in the first five months of the year is pretty good, but our indicators are all outperforming the buy-and-hold approach. Here is the performance of our indicators in 2015, through May 29th:
- VXX Bias: +69%
- VRP: +60%
- VRP+VXX Bias: +71%
The equity curve for each strategy with comparison to XIV is shown in the following graph (the S&P 500 is +2.4% YTD and is not shown):

Trade statistics for each strategy are summarized as follows:
If you're not quite meeting your investment objectives this year perhaps we can help. For less than $3 per day we provide subscribers access to all of our VIX data & metrics, our indicators, automated change alerts, and the members' forum.
For those interested in additional detail, the daily history of indicator values that have been emailed to subscribers in 2015 can be found in the data sheet links below:
- VXX Bias: 2015
- VRP: 2015
- VRP+VXX Bias: 2015
______
Hypothetical and Simulated Performance Disclaimer
The results are based on simulated or hypothetical performance results that have certain inherent limitations. Unlike the results shown in an actual performance record, these results do not represent actual trading. Also, because these trades have not actually been executed, these results may have under- or over-compensated for the impact, if any, of certain market factors, such as lack of liquidity. Simulated or hypothetical trading programs in general are also subject to the fact that they are designed with the benefit of hindsight. No representation is being made that any account will or is likely to achieve profits or losses similar to these being shown. Additional performance differences in backtests arise from the methodology of using the 4:00pm ET closing values for XIV, VXX, and ZIV as approximated trade prices for indicators that require VIX and VIX futures to settle at 4:15pm ET.
-JW
. . . . . . . . . . . . . .
Stay up to date by having posts sent directly to your
RSS feed or
Email.
Subscribe to:
Posts (Atom)